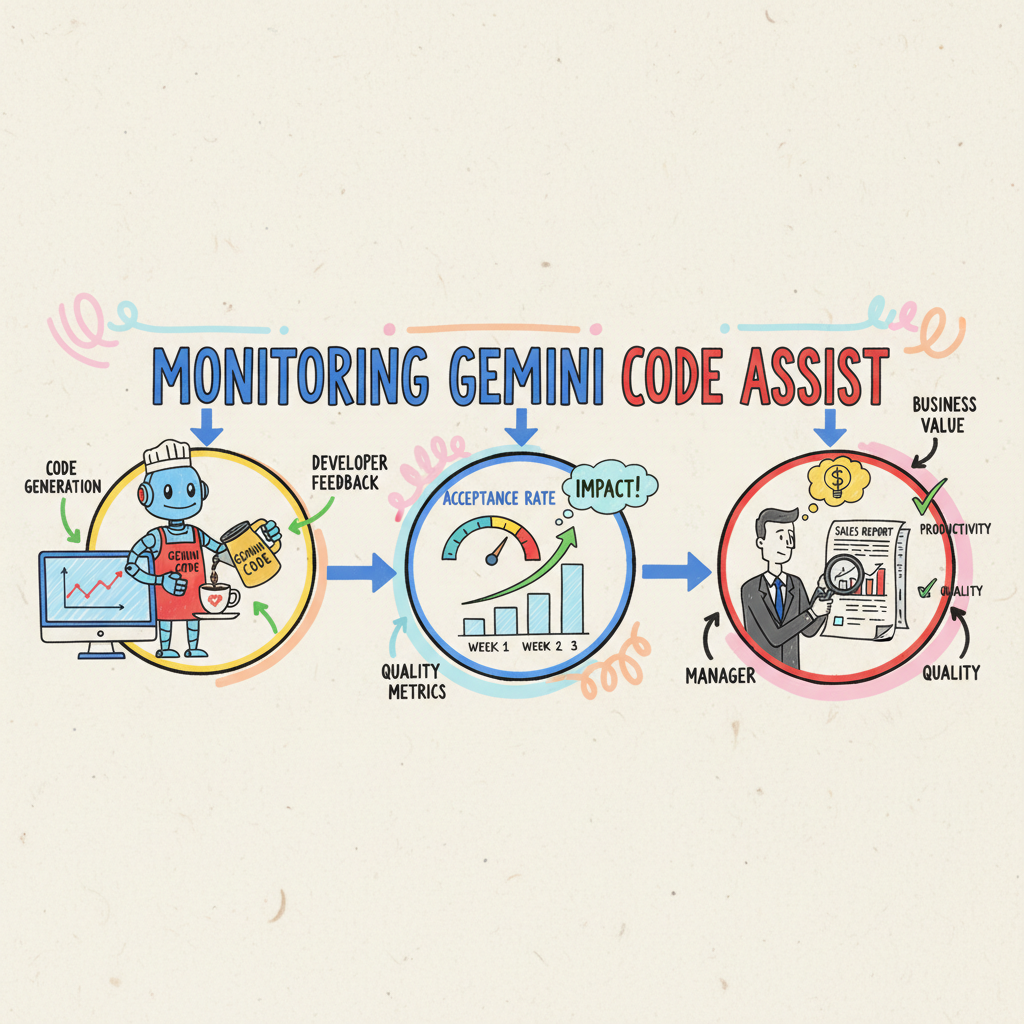
📊📈 Is Your AI Barista Actually Helping? Monitoring Gemini Code Assist
So, you’ve equipped your entire team of developers with a brand-new, top-of-the-line AI assistant. Gemini Code Assist is like having a world-class barista whispering expert advice, suggesting new recipes, and finishing sentences to help your team craft code faster than ever. The initial buzz is fantastic, and everyone loves the shiny new tool.
But as the manager of this bustling software cafe, a question starts to brew in your mind: Is it actually helping?
Are your developers just enjoying the novelty, or is this AI barista genuinely improving the quality and speed of your coffee (code)? How do you measure the return on investment for a tool that’s so deeply integrated into the creative process?
You need to look beyond the hype and check the daily sales report. Thankfully, Google Cloud has made this easier than ever.
The Evolution of Your Cafe’s POS System
Monitoring your AI barista has evolved over time, moving from a simple cash box to a sophisticated, real-time analytics platform.
Phase 1: The Original “Gemini for Google Cloud” Dashboard From early on, we had an out-of-the-box dashboard that was like a basic cash register. It was great for getting a quick headcount, providing insights into:
- Active Users (Daily, 7-day, and 28-day)
- Total Response Count
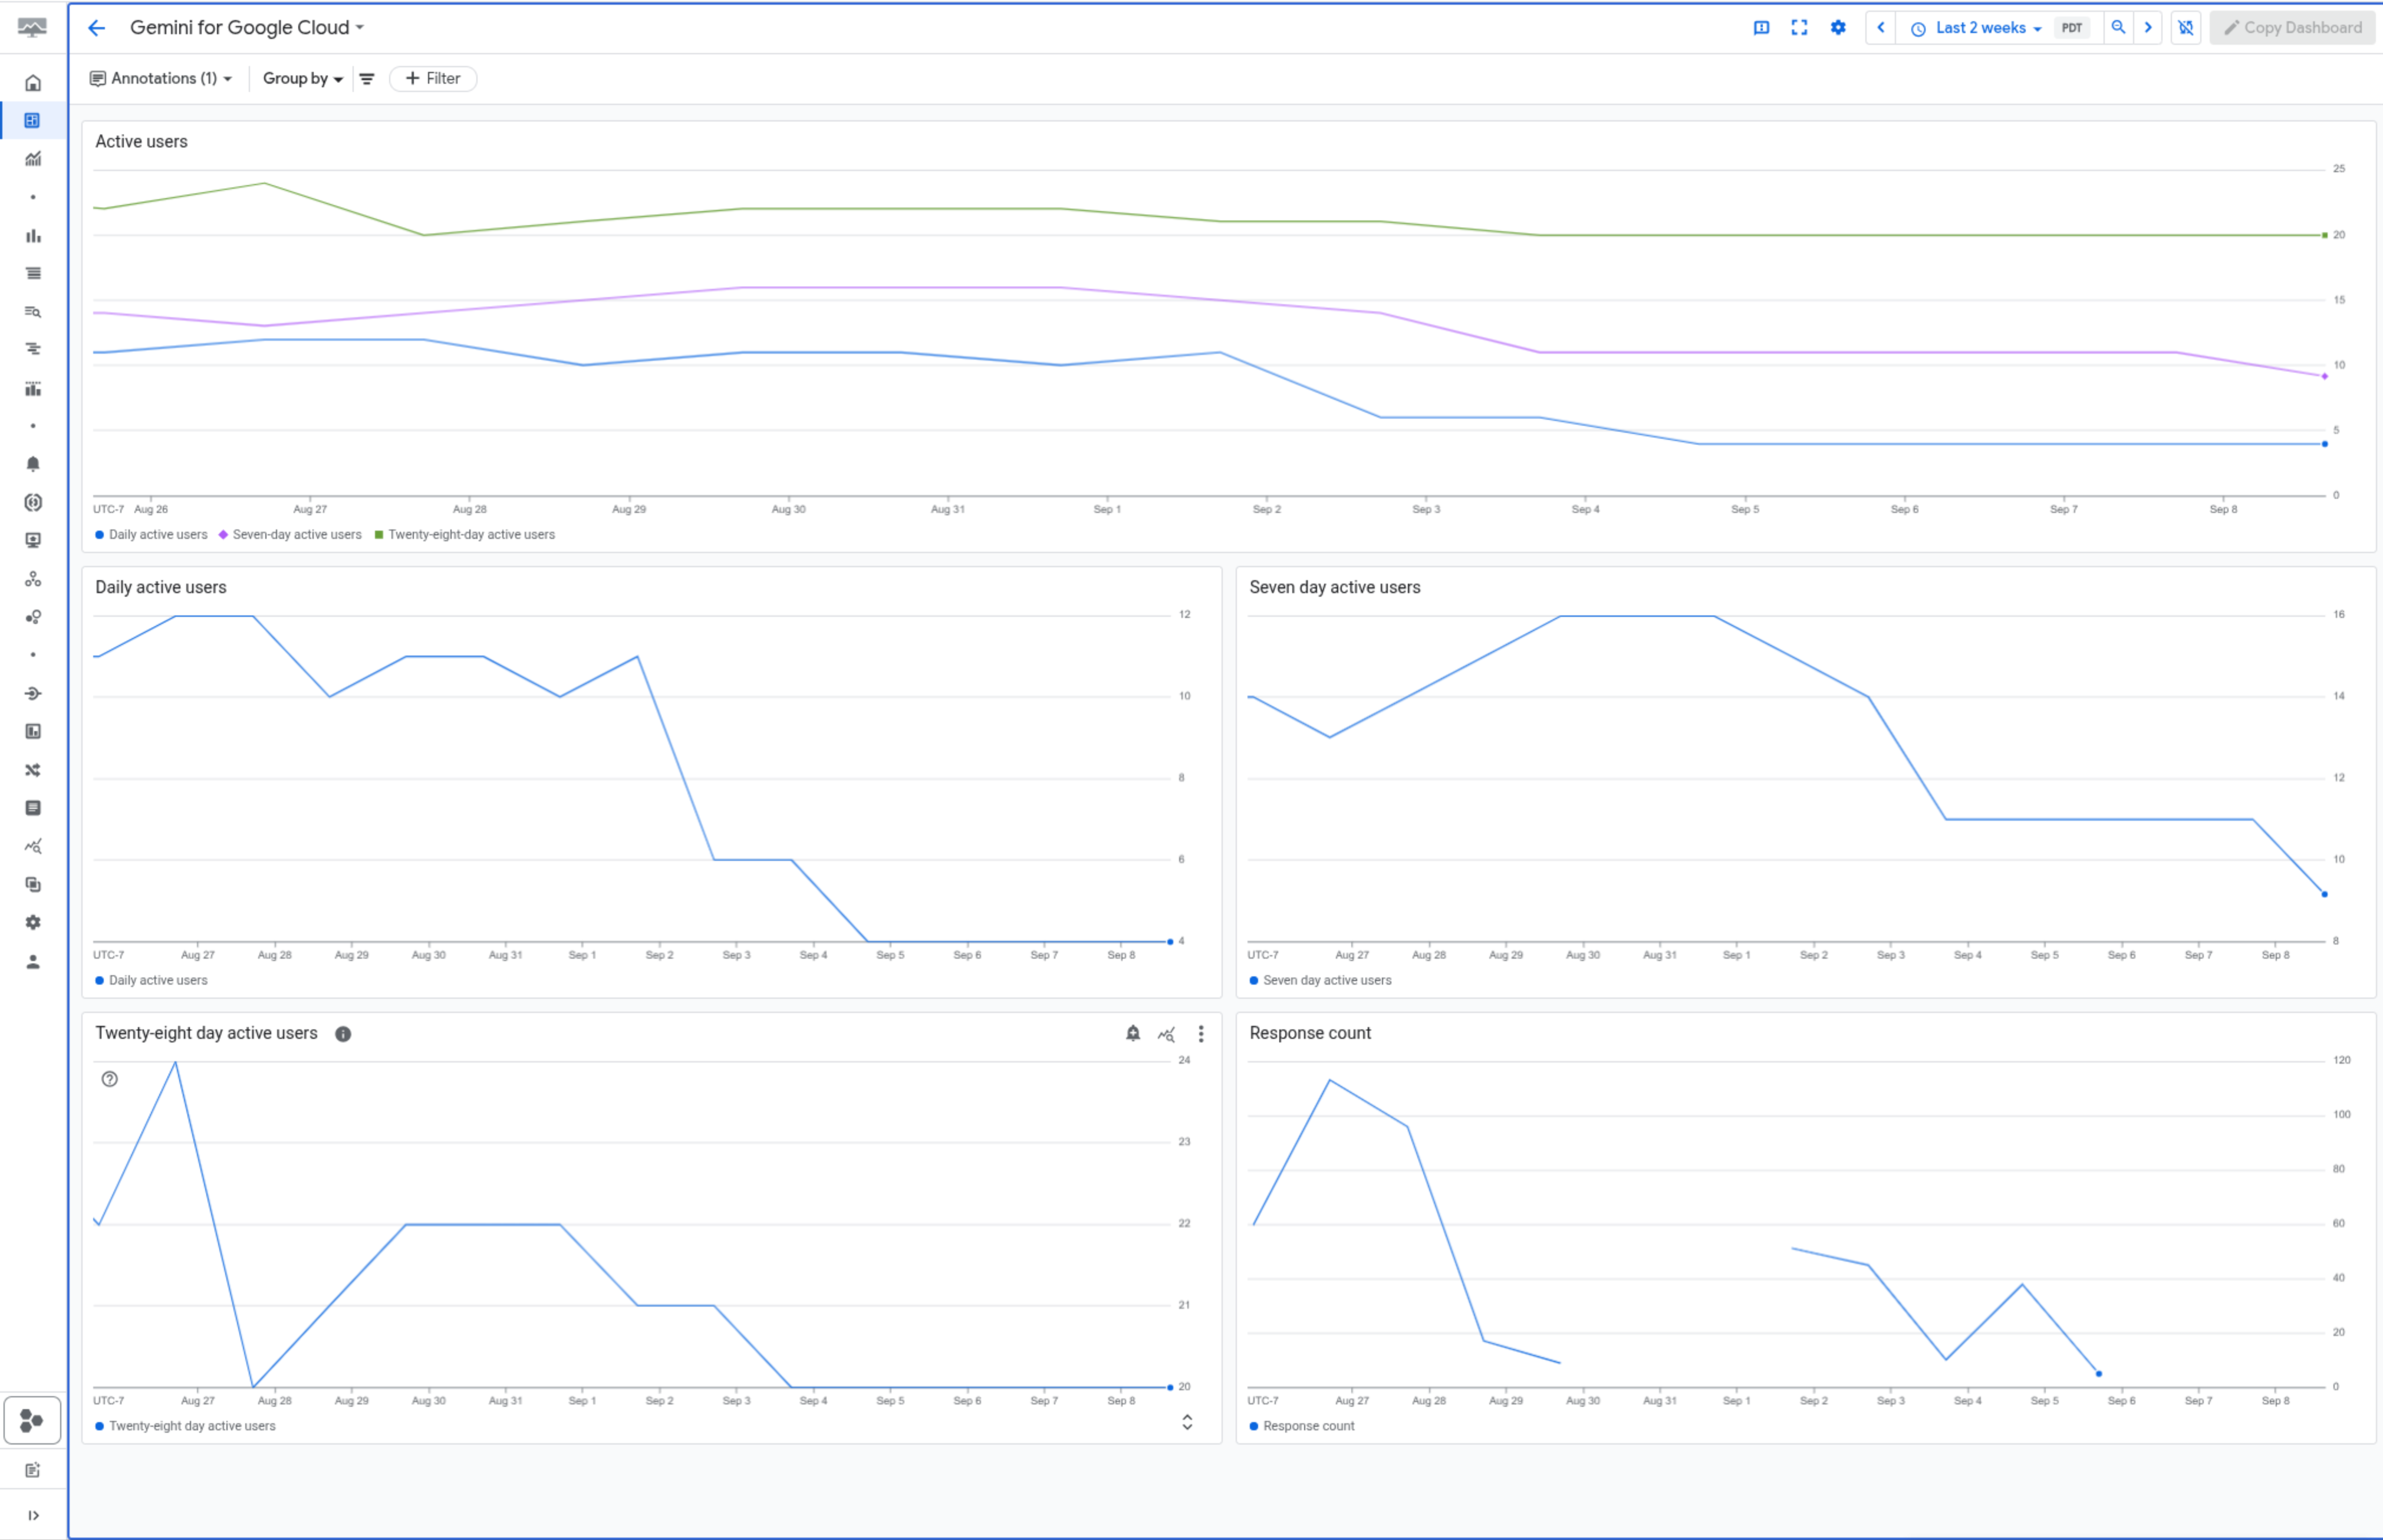
It is useful, but it doesnt tell you what people were buying or if they liked the coffee.
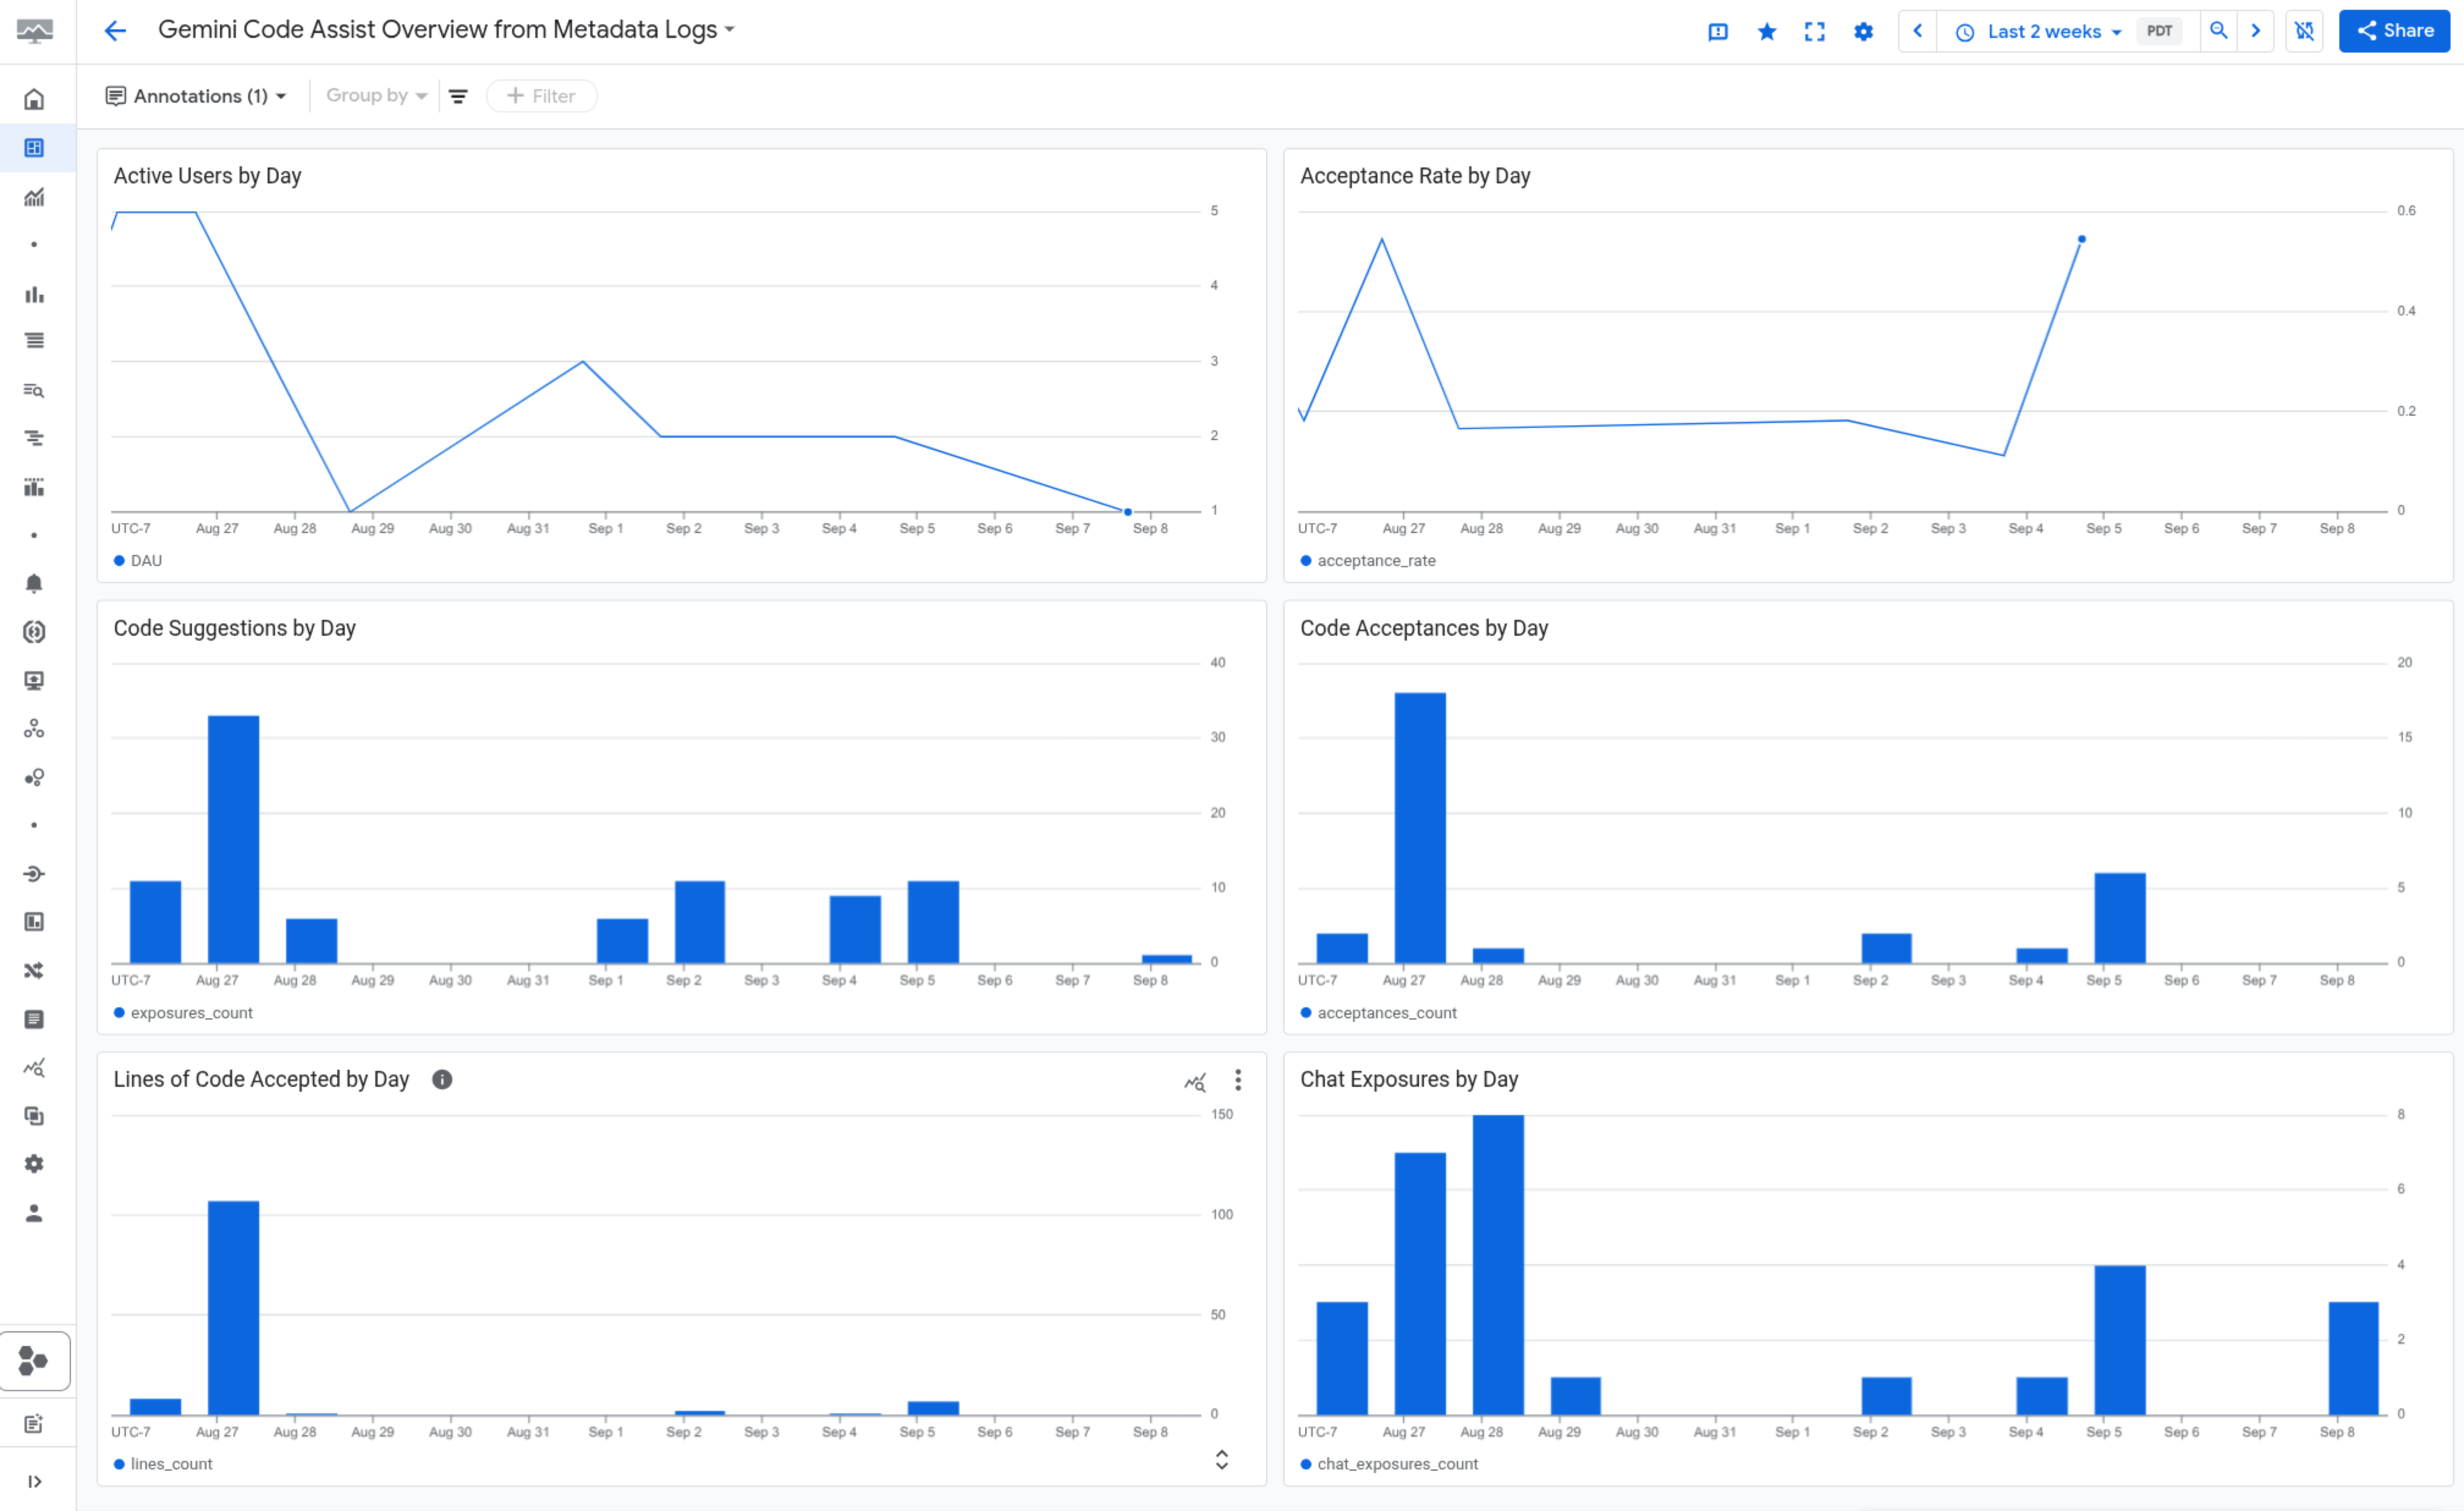
Phase 2: The Power User’s Custom Ledger (Log Analytics) For a deeper understanding, you could become a data detective. This method required you to configure Log Analytics to export audit logs to BigQuery and then build or customize a dashboard using samples from a GitHub repository. This was like setting up a detailed accounting ledger. It was powerful and gave you granular insights like:
- Acceptance Rate by Day
- Code Suggestions vs. Acceptances by Day
- Lines of Code Accepted
- Chat Exposures by Day
This approach offers incredible flexibility, and I’ve seen customers build awesome, highly customized dashboards to track very specific KPIs. It’s still the best option for teams that want to create their own “custom blends” of metrics.
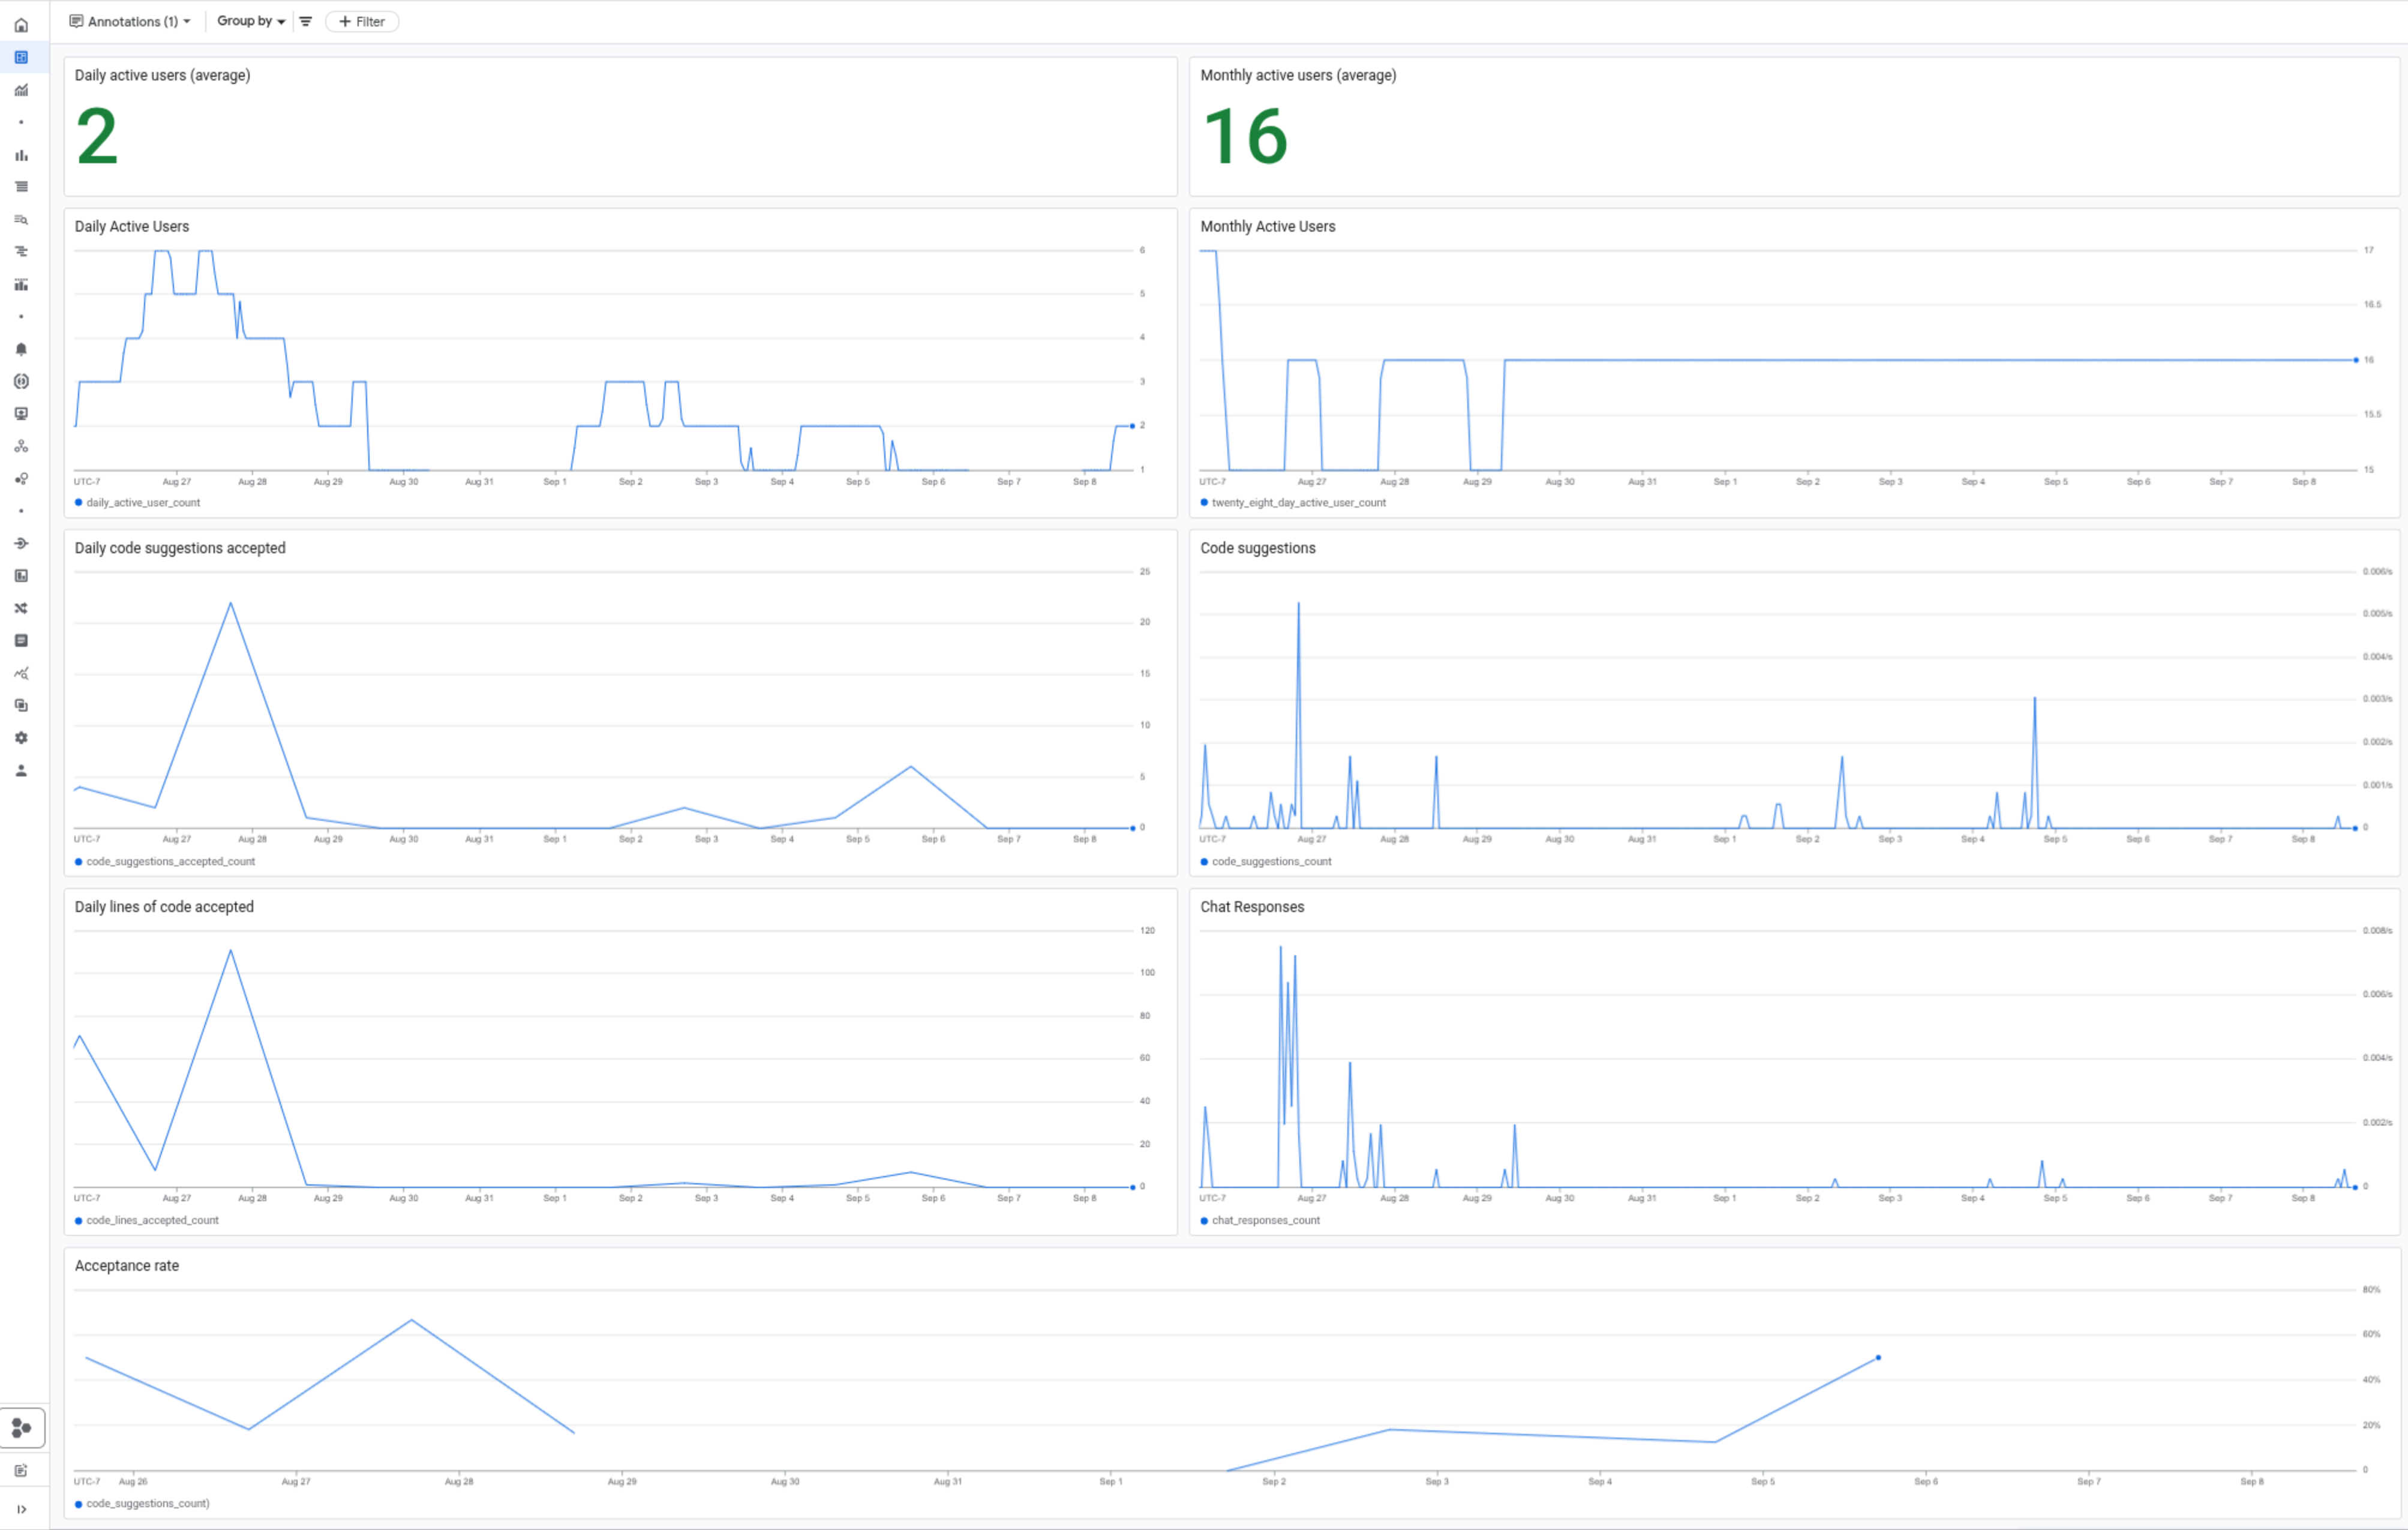
Phase 3: The Modern, All-in-One System (The New Dashboard) As of September 4th, 2025, Google Cloud has rolled out a brand-new, built-in monitoring dashboard that combines the best of both worlds. It gives you the simplicity of the original dashboard with the rich, actionable metrics of the Log Analytics method, all with zero setup. It’s like upgrading to a modern POS system that gives you instant, detailed sales reports. The new dashboard provides:
- Daily and Monthly Active Users (including averages)
- Daily Code Suggestions and Acceptances
- Daily Lines of Code Accepted
- Chat Responses
- And crucially, Acceptance Rates
What’s Brewing Next: Upcoming Metrics ☕ The great news is that this dashboard is just getting started. Google will be adding even more granular metrics to give you a deeper understanding of your team’s usage, including:
- Code suggestions (daily)
- Chat exposures
- Number of AI characters
- % of AI characters
Why Monitor Your AI Assistant? (The Manager’s Morning Brew)
Before we dive into the metrics, let’s be clear on why this is so important. The built-in dashboard is great at telling you what is happening, but to truly understand the impact, we need to think about the so what.
DORA recently wrote an article looking at frameworks for measuring the impact of AI on developer productivity. They advocate for a holistic view that goes beyond simple activity metrics. Monitoring Gemini Code Assist isn’t about micromanaging; it’s about using data to answer crucial questions about your team’s performance and satisfaction.
We can boil it down to three critical areas:
- Adoption & Engagement: Is the team actually using the new espresso machine, or is it gathering dust in the corner?
- Value & Impact: Are the AI’s suggestions genuinely making the team more productive and improving the developer experience, or is it just creating more work?
- Cost & Optimization: How much is this new assistant costing you, and are you getting the most value out of your investment?
The Key Metrics (Your New, Automatic Sales Report)
The new Gemini Code Assist dashboard gives you a clean, aggregated view of how the tool is being used across your organization. Let’s break down what you’ll see on your new “sales report”:
-
Active Users: Who’s Actually Using the New Espresso Machine? This is your most basic adoption metric. It shows you how many developers are actively using Gemini Code Assist over a period. If you see this number trending up, it’s a great sign that the tool is becoming a regular part of your team’s workflow.
-
Suggestion Acceptance Rate: Are the Recipe Suggestions Any Good? This is arguably the most important metric for measuring value. It shows the percentage of times a developer accepts a code suggestion from Gemini. A high acceptance rate is a strong indicator that the AI is providing useful, high-quality, and relevant code, saving your developers significant time and effort.
-
Code Completion Acceptance Rate: How Much of the Drink Did They Make? This is a subset of the overall acceptance rate, focusing specifically on “ghost text” or type-ahead completions. A high rate here means Gemini is effectively predicting what your developers are about to type, leading to small but frequent productivity gains.
Beyond the Dashboard: Brewing Your Own Reports with the API
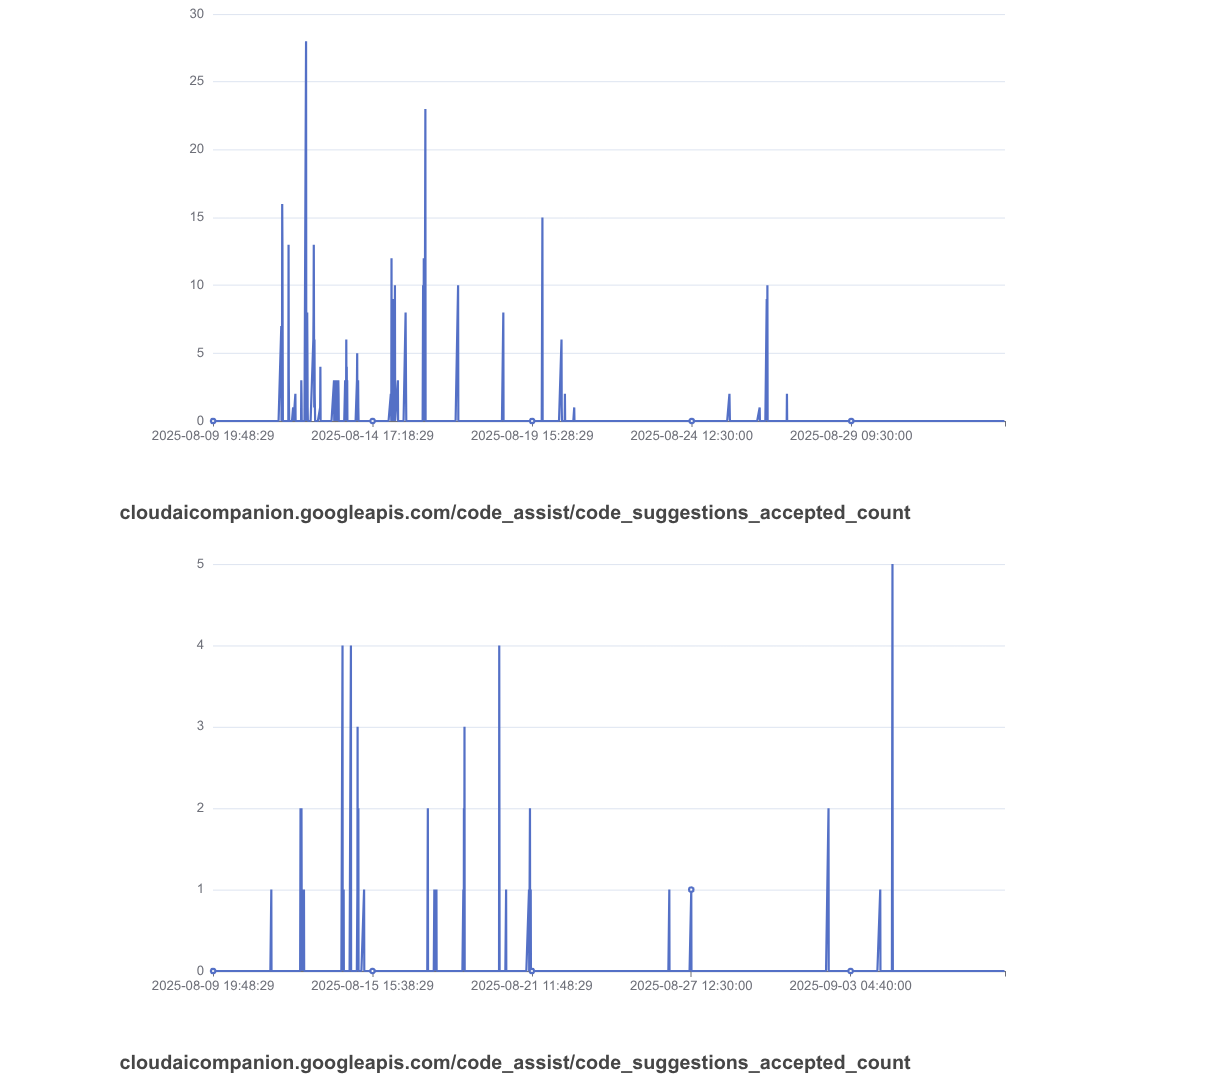
One of the coolest things about having these metrics available out-of-the-box is that they aren’t just siloed in the dashboard. They are standard Cloud Monitoring metrics. This means you can easily access them programmatically to build your own custom reports, integrate with third-party tools, or set up custom alerts.
You can find all the raw metrics by exploring in Cloud Monitoring:
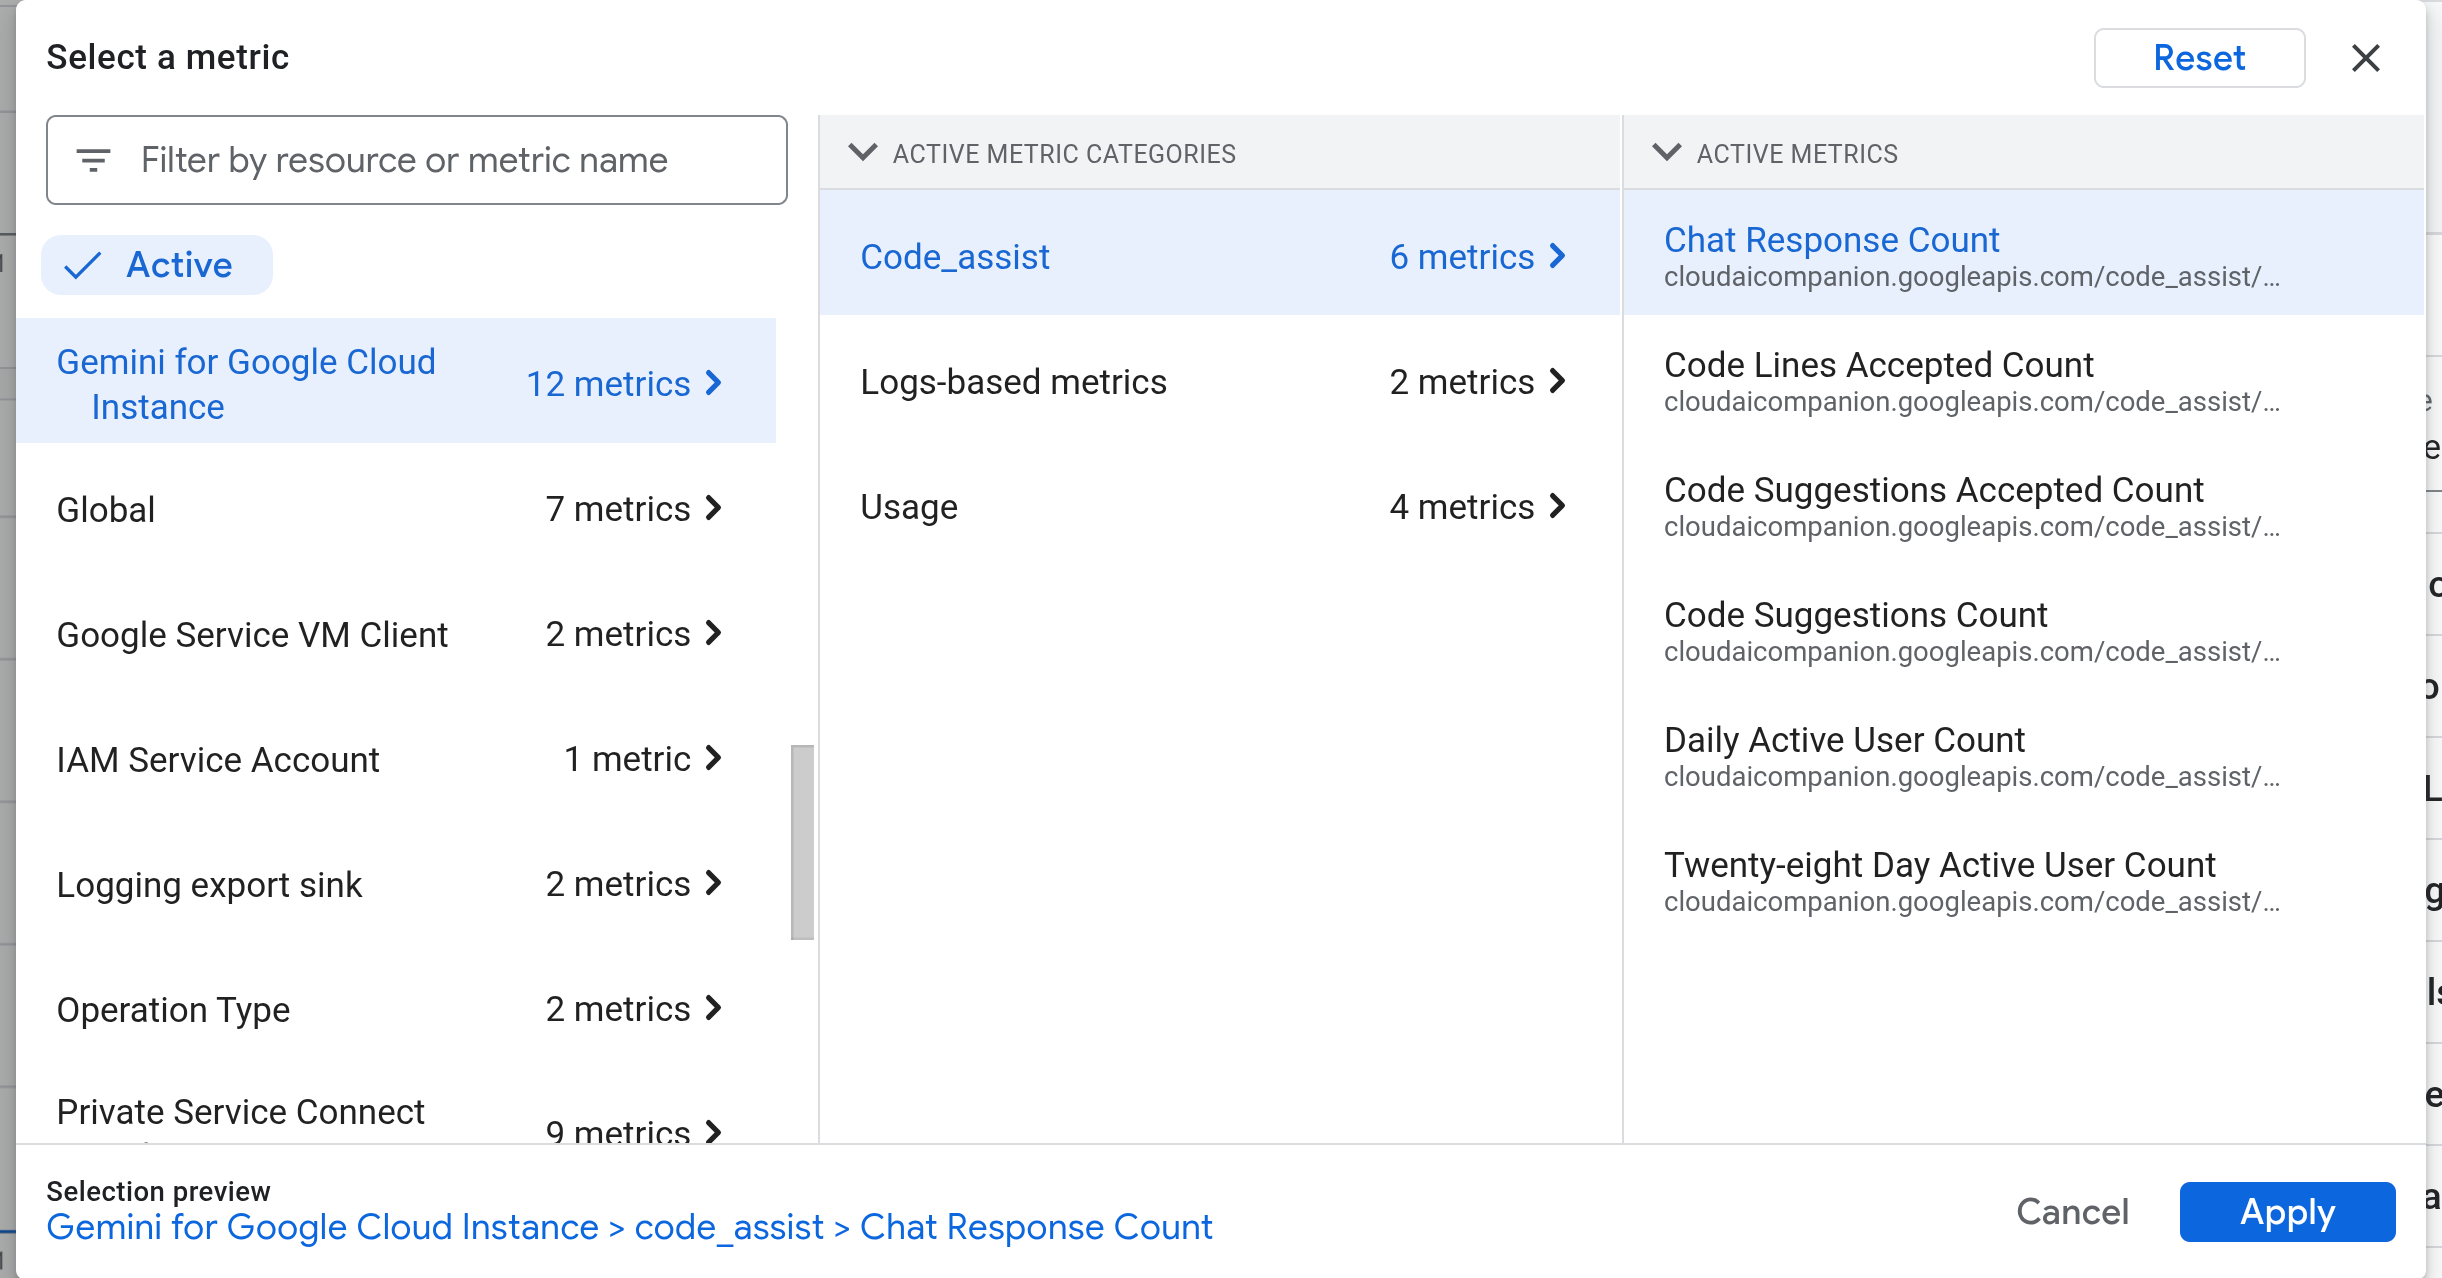
Because these are standard metrics, you can query them directly using the Cloud Monitoring API. For example, here’s a simple curl command to pull the daily active user count for the last 24 hours:
|
|
This opens up a world of possibilities for creating your own custom “blends” of data, just like with the more advanced Log Analytics method, but with the simplicity of a pre-defined metric. As an example of this, I’ve started experimenting with a simple Go-based collector to query and extract this data, which you can find on GitHub: sapientcoffee/gca-observability.
From Beans to Business Value
Looking at these metrics allows you to connect the dots between a cool new tool and real business outcomes. A rising acceptance rate doesn’t just mean developers are happy; it translates directly to increased productivity, faster feature delivery, and potentially higher-quality code with fewer bugs.
By monitoring these trends, you can justify the investment, identify teams that might need more training, and make data-driven decisions about how to best leverage AI assistance in your development lifecycle.
Ready to Check the Till?
Getting started is the best part: you don’t have to do anything. If you have a Gemini Code Assist subscription for your organization, the monitoring dashboard is already available to you.
How to Find the Dashboards
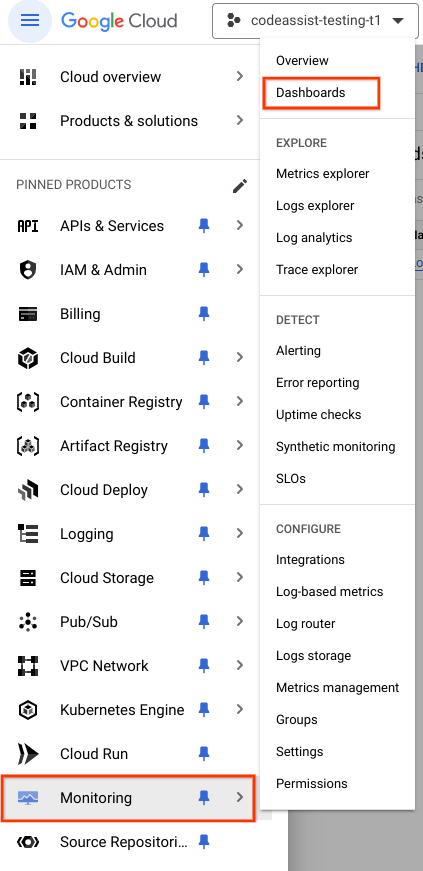
You can find all the available dashboards in the Google Cloud Console:
- Navigate to the Monitoring section in the main menu.
- Select Dashboards.
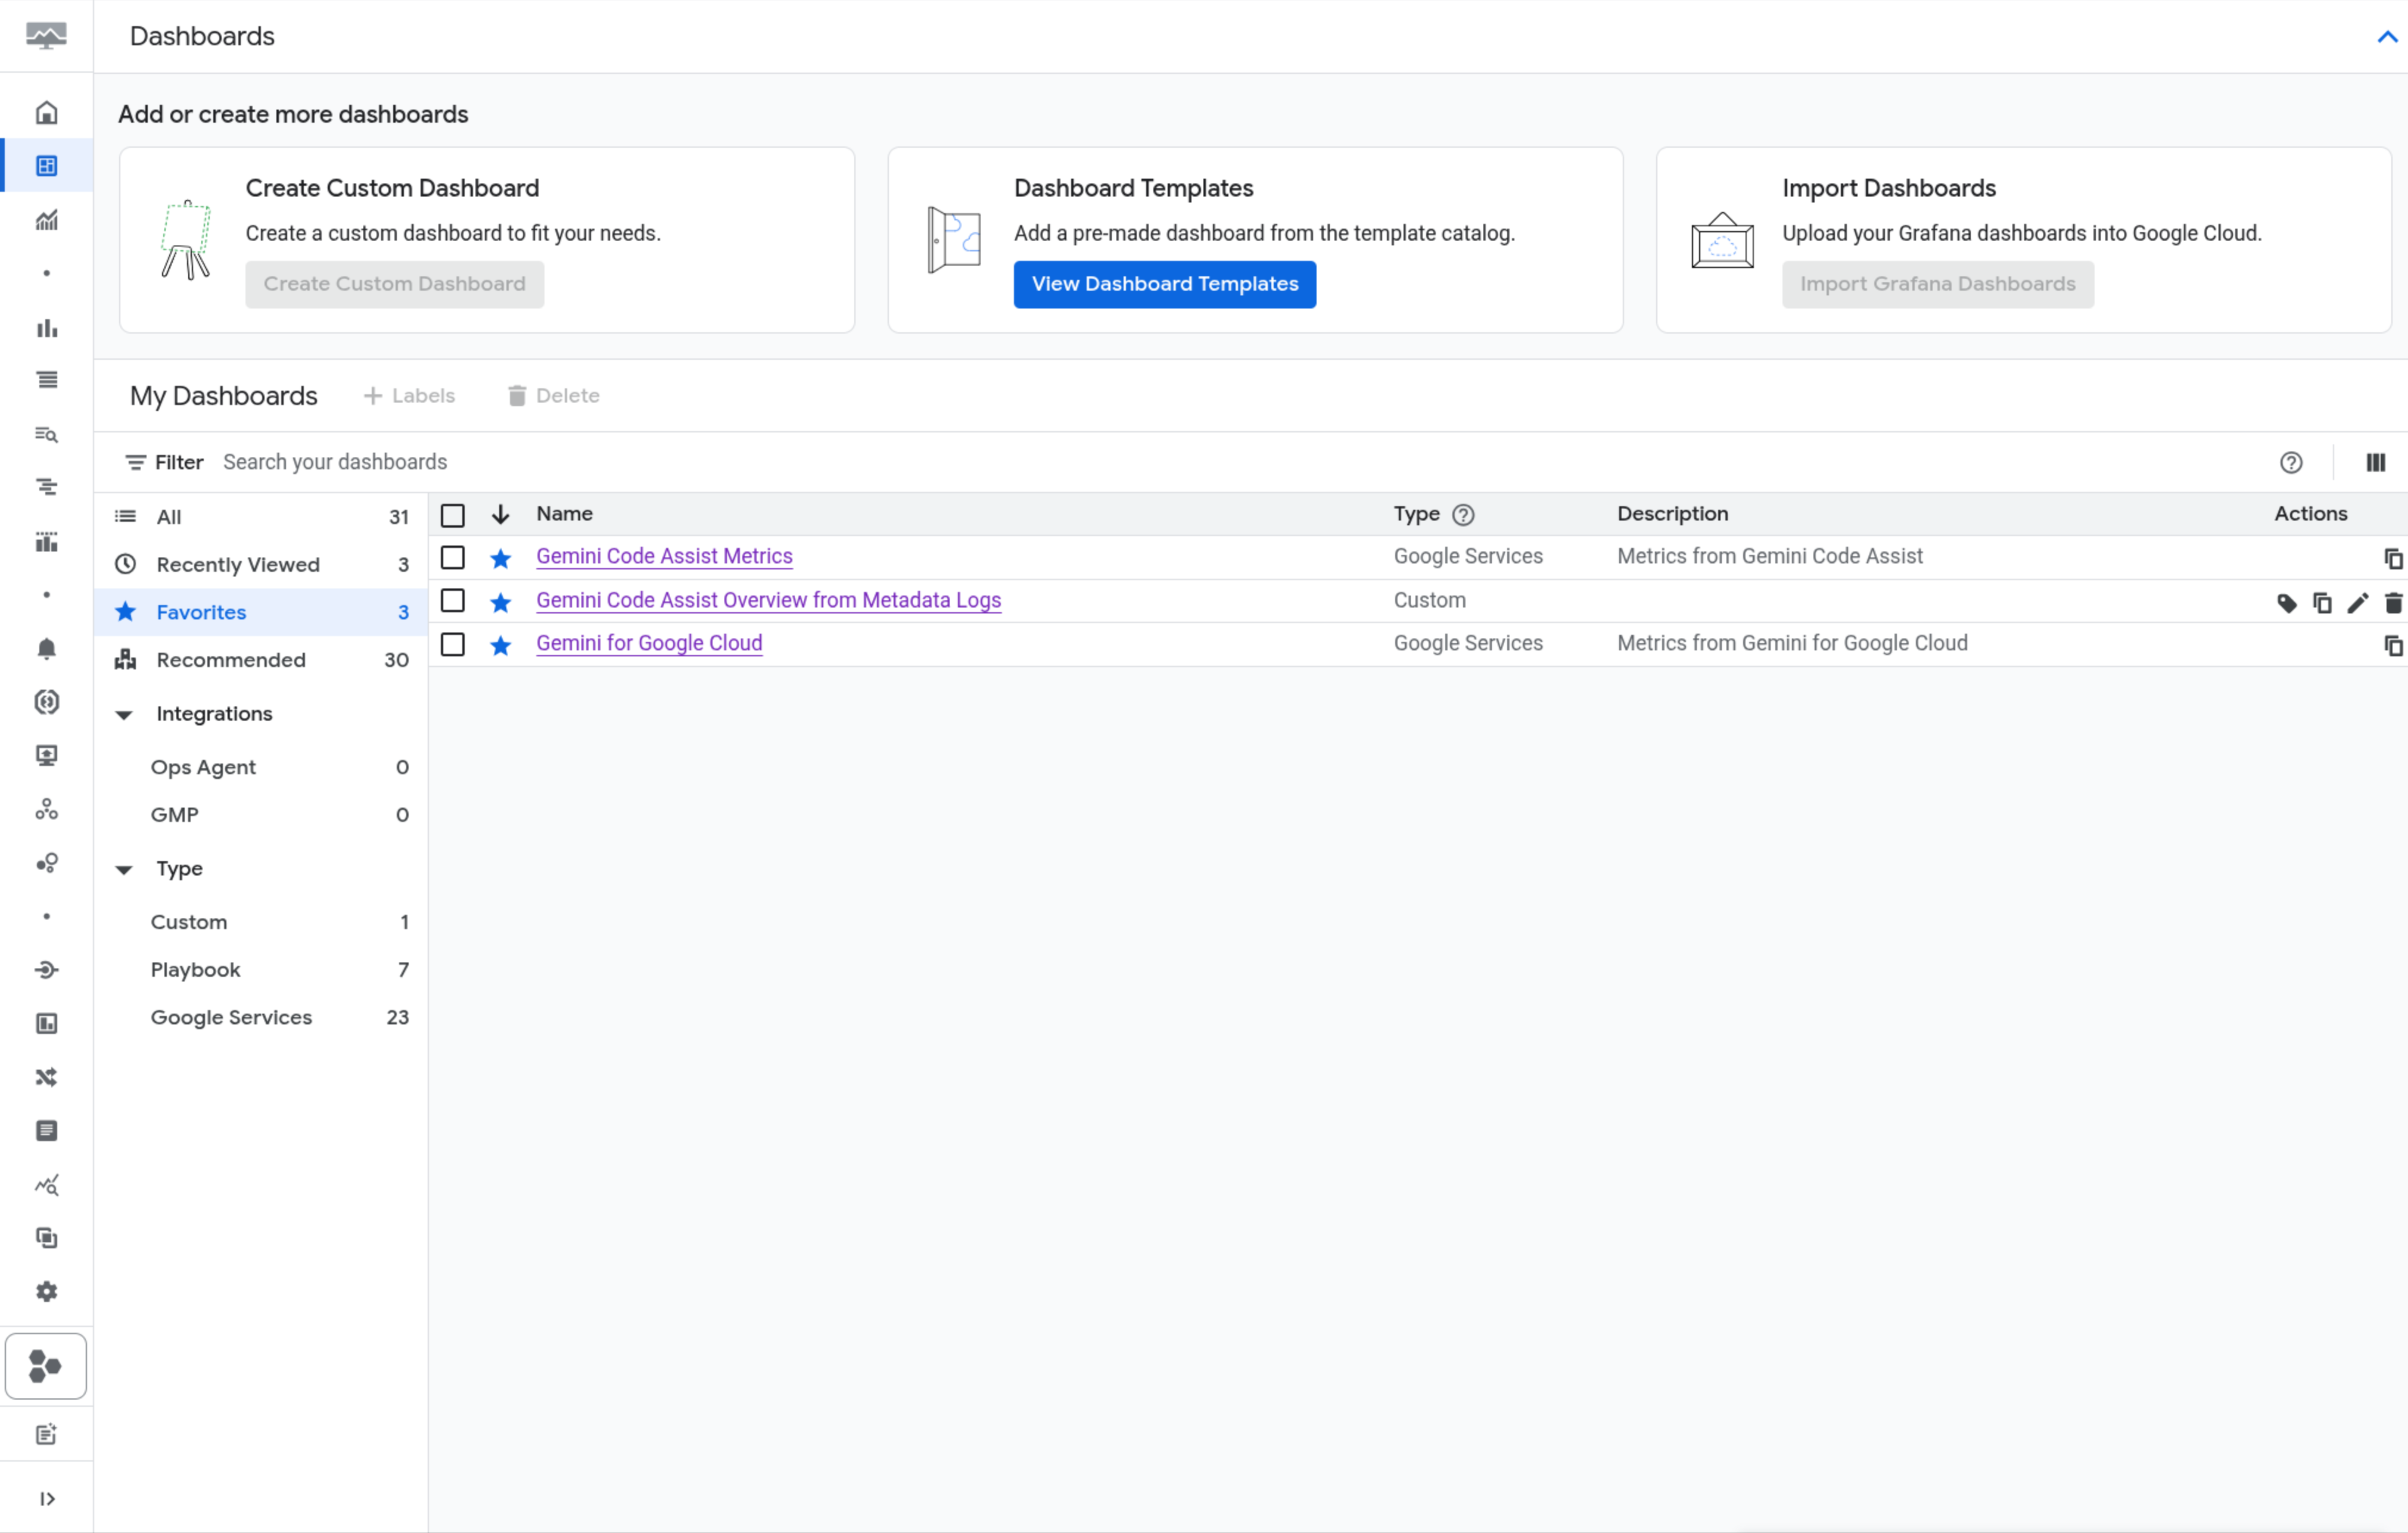
From there, you’ll see a list of all available dashboards, including the new Gemini Code Assist dashboard and any custom ones you may have created.
For more details, you can always consult the official documentation.
So, go ahead and take a look. See if your AI barista is just a friendly face or a true master of their craft, helping you brew better code, faster.
Happy monitoring! 🚀
How are you measuring the impact of AI assistants on your team? I’d love to hear your thoughts!