One of the great features of UCS Director is its Rest API. This is key if you want to interact with it programmatically or integrate with other products (like Prime Service Catalog, which Cisco has done as part of the Cisco Enterprise Cloud Suite).
The API’s use GET and POST methods over HTTP or HTTPS. Input parameters and responses are encoded using JSON.
To access UCSD via the API you need to know two things;
- API Key for authentication
- API to call including syntax
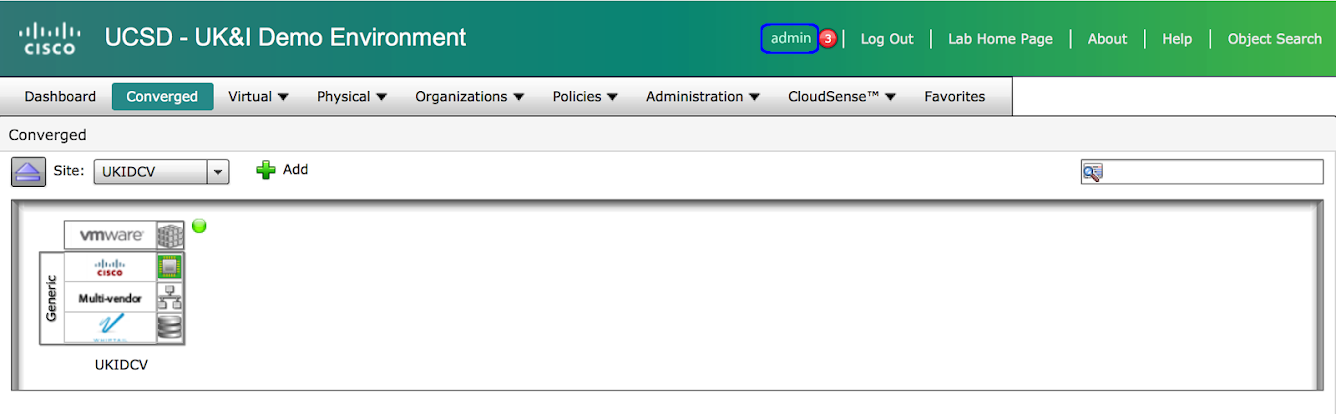
The API key is passed in the header of the request (X-Cloupia-Request-Key). You can obtain the unique key associated with your user name by logging on via the GUI.
- Login and click your username in the top right hand corner
-
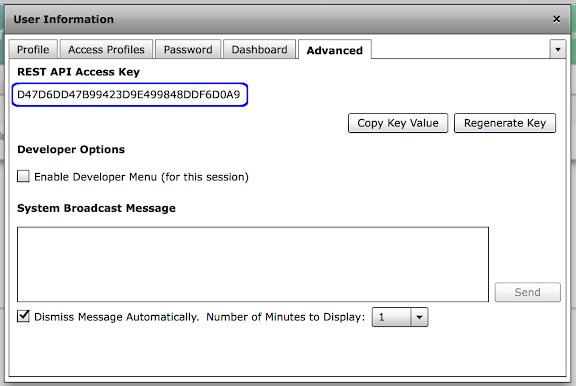
A ‘User Information’ dialog will popup, you will need to go to the ‘Advanced’ tab. You will see the Access Key string.
-
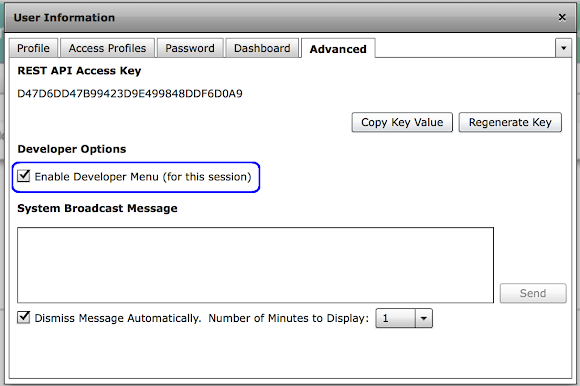
[OPTIONAL] This step isn’t required for communicating with the API however this feature will be used further on in the blog post to help understand the API syntax and calls (saves us revisiting). Select the ‘Enable Developer Menu’.
Now we have the key we can start to make requests.
X-Cloupia-Request-Key:D47D6DD47B99423D9E499848DDF6D0A9
This will be used in the HTTP Header.
API Call
The 1st question I had was around how can I query UCSD to find out the status of the service requests. The API that looked to do the job was (ill come on to how I worked that out);
NOTE: for formatting reasons I have changed this from a single line and put carriage returns in.
http://ukidcv-cucsd/app/api/rest?opName=
userAPIGetTabularReport&opData={param0:”6”,param1:””,param2:”SERVICE-REQUESTS-T10”}
Now we have both the API Key and the API to query we can test.
You can use a number of different tools to query API’s. The best CLI method in my eyes would be to use cURL;
curl -X “GET” “http://ukidcv-cucsd/app/api/rest?opName=userAPIGetTabularReport&opData=%7Bparam0:%226%22,param1:%22%22,param2:%22SERVICE-REQUESTS-T10%22%7D” \
    -H “X-Cloupia-Request-Key: D47D6DD47B99423D9E499848DDF6D0A9”
The output would be something like this;
	% Total    % Received % Xferd  Average Speed   Time    Time     Time  Current
	                                 Dload  Upload   Total   Spent    Left  Speed
	100 65946    0 65946    0     0   144k      0 —:—:— —:—:— —:—:—  144k
	{ “serviceResult”:{“rows”:[{“Service_Request_Id”:552,”Request_Type”:”Admin Workflow”,”Initiating_User”:”admin”,”Group”:””,”Catalog_Workflow_Name”:”HTTP_Function_Object”,”Initiator_Comments”:””,”Request_Time”:”Mar 20, 2015 14:13:26 UTC”,”Request_Status”:”Complete”,”Rollback_Type”:””,”Catalog”:”Yes”},{“Service_Request_Id”:551,”Request_Type”:”Advanced”,”Initiating_User”:”user”,”Group”:”Default Group”,”Catalog_Workflow_Name”:”Fenced Container Setup”,”Initiator_Comments”:””,”Request_Time”:”Mar 20, 2015 10:34:27 UTC”,”Request_Status”:”Complete”,”Rollback_Type”:””,”Catalog”:”Yes”}],”columnMetaData”:null,”reportParams”:{}}, “serviceError”:null, “serviceName”:”InfraMgr”, “opName”:”userAPIGetTabularReport”
Its not the nicest format as the output is raw, if its formatted you get;
	{
		  “serviceResult”: {
		    “rows”: [
		      {
		        “Service_Request_Id”: 552,
		        “Request_Type”: “Admin Workflow”,
		        “Initiating_User”: “admin”,
		        “Group”: “”,
		        “Catalog_Workflow_Name”: “HTTP_Function_Object”,
		        “Initiator_Comments”: “”,
		        “Request_Time”: “Mar 20, 2015 14:13:26 UTC”,
		        “Request_Status”: “Complete”,
		        “Rollback_Type”: “”,
		        “Catalog”: “Yes”
		      },
		      {
		        “Service_Request_Id”: 551,
		        “Request_Type”: “Advanced”,
		        “Initiating_User”: “user”,
		        “Group”: “Default Group”,
		        “Catalog_Workflow_Name”: “Fenced Container Setup”,
		        “Initiator_Comments”: “”,
		        “Request_Time”: “Mar 20, 2015 10:34:27 UTC”,
		        “Request_Status”: “Complete”,
		        “Rollback_Type”: “”,
		        “Catalog”: “Yes”
		      },

		    ],
		    “columnMetaData”: null,
		    “reportParams”: {}
		  },
		  “serviceError”: null,
		  “serviceName”: “InfraMgr”,
		  “opName”: “userAPIGetTabularReport”
		}
This is obviously a lot more human readable.
If you are more graphically inclined (and I am these days when investigating new API’s) I would recommend either the postman browser plugin which is free or my now preferred option of Paw which has a cost associated (and Mac only).
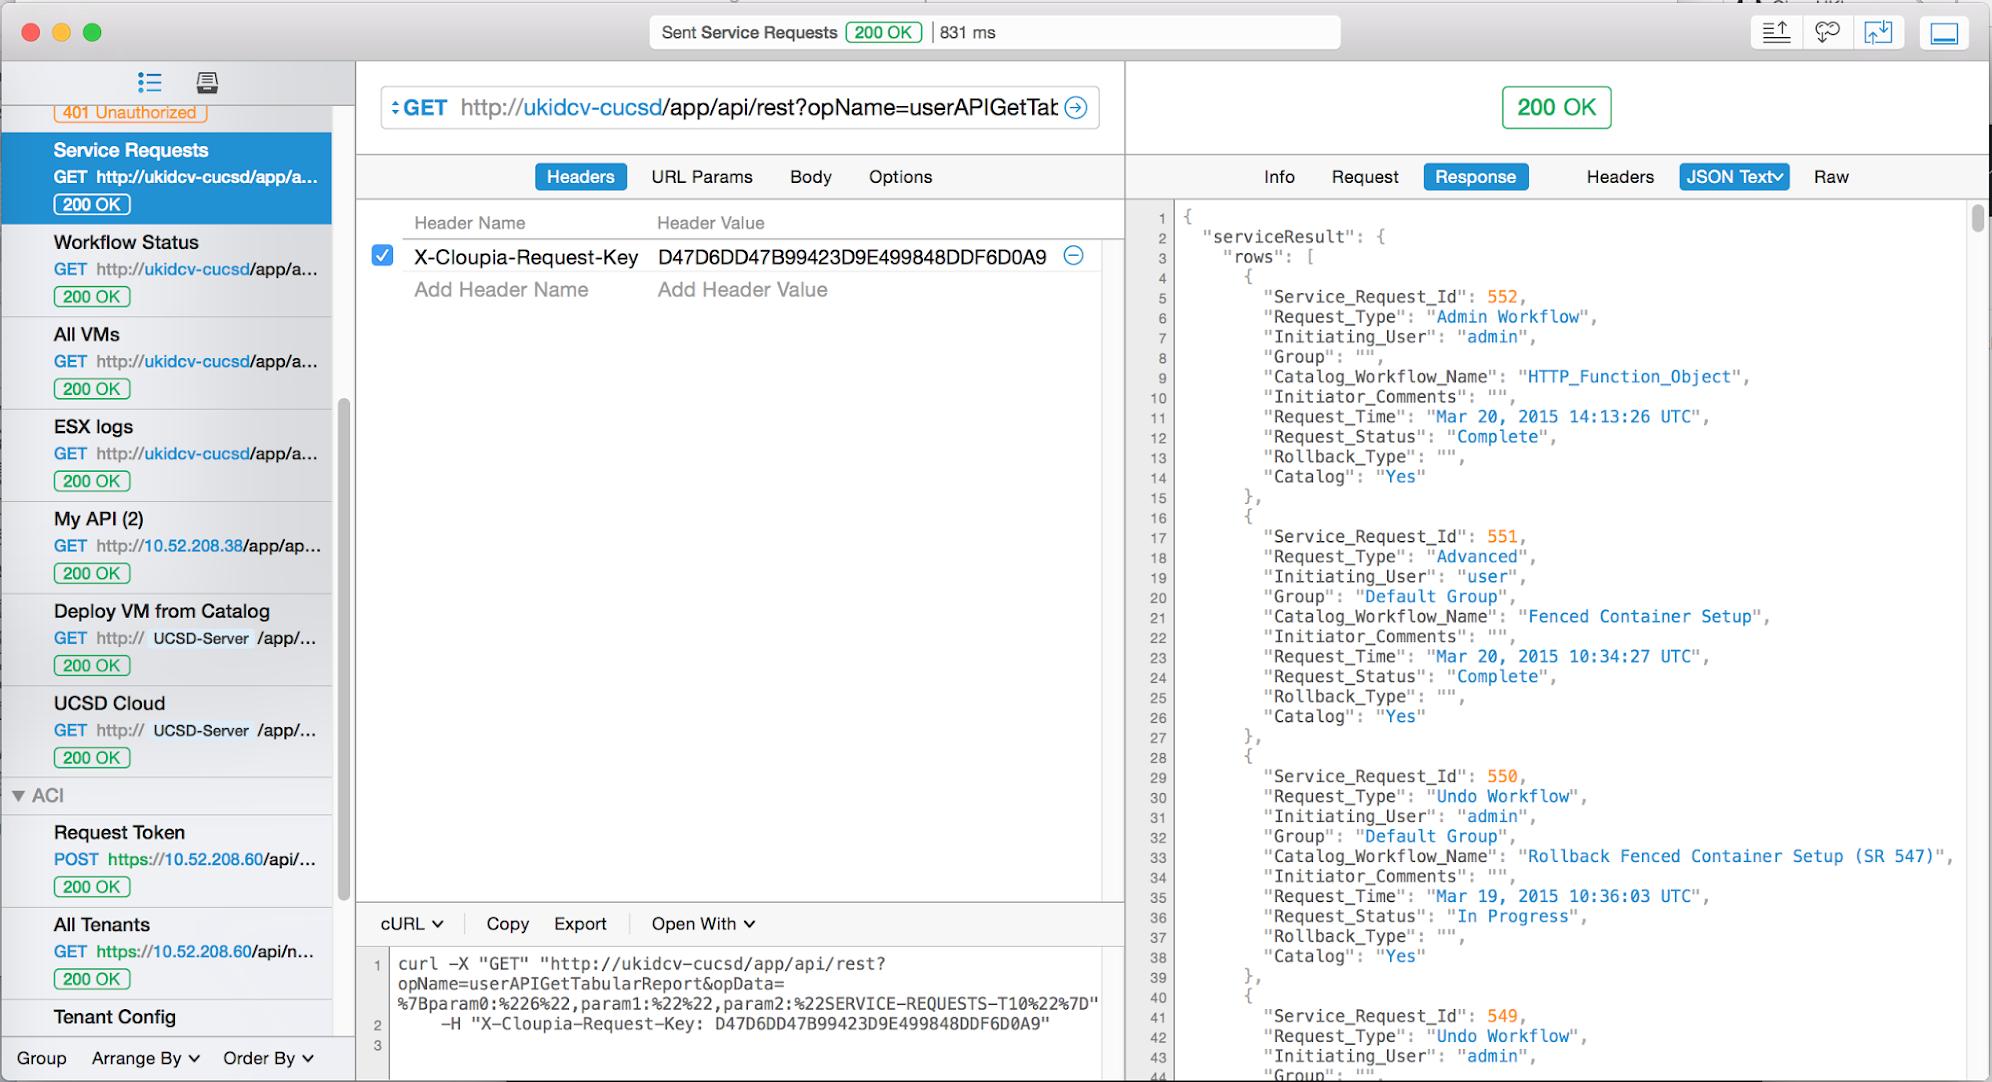
You can see above how you enter the API and also define the header.
Working Examples
The following are just 2 example to give you an ideal to how things work. I suspect I will create a number of blogs involving the API so what this space!
Python Script
I thought I would create a demo using a Python script to return the service request list.
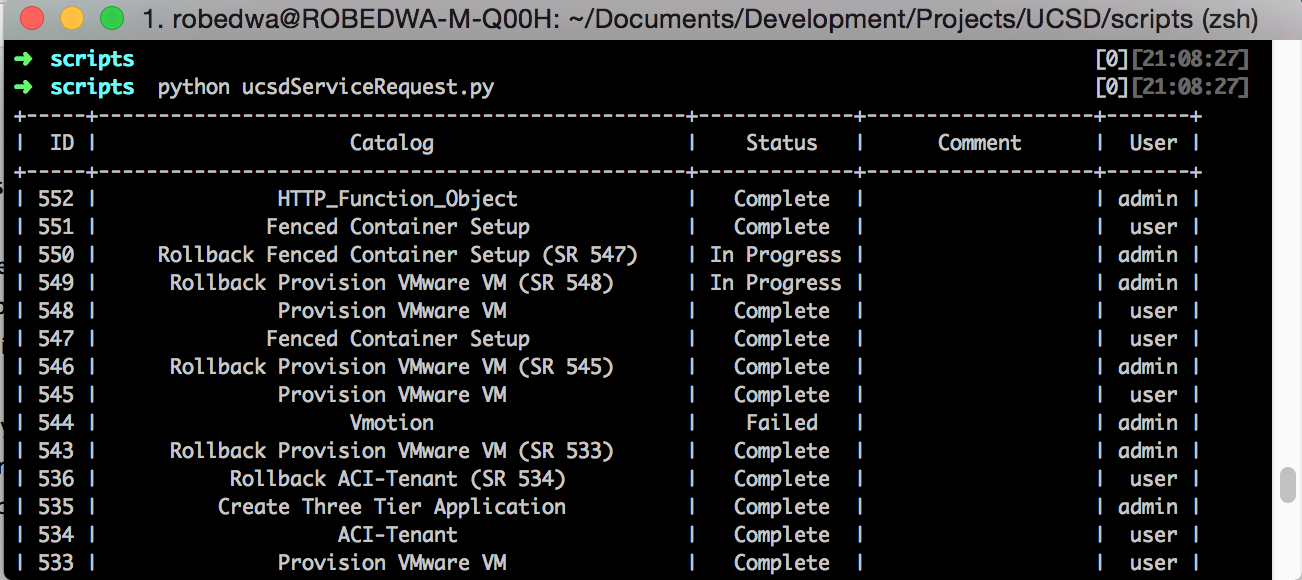
The source code can be found on GitHub
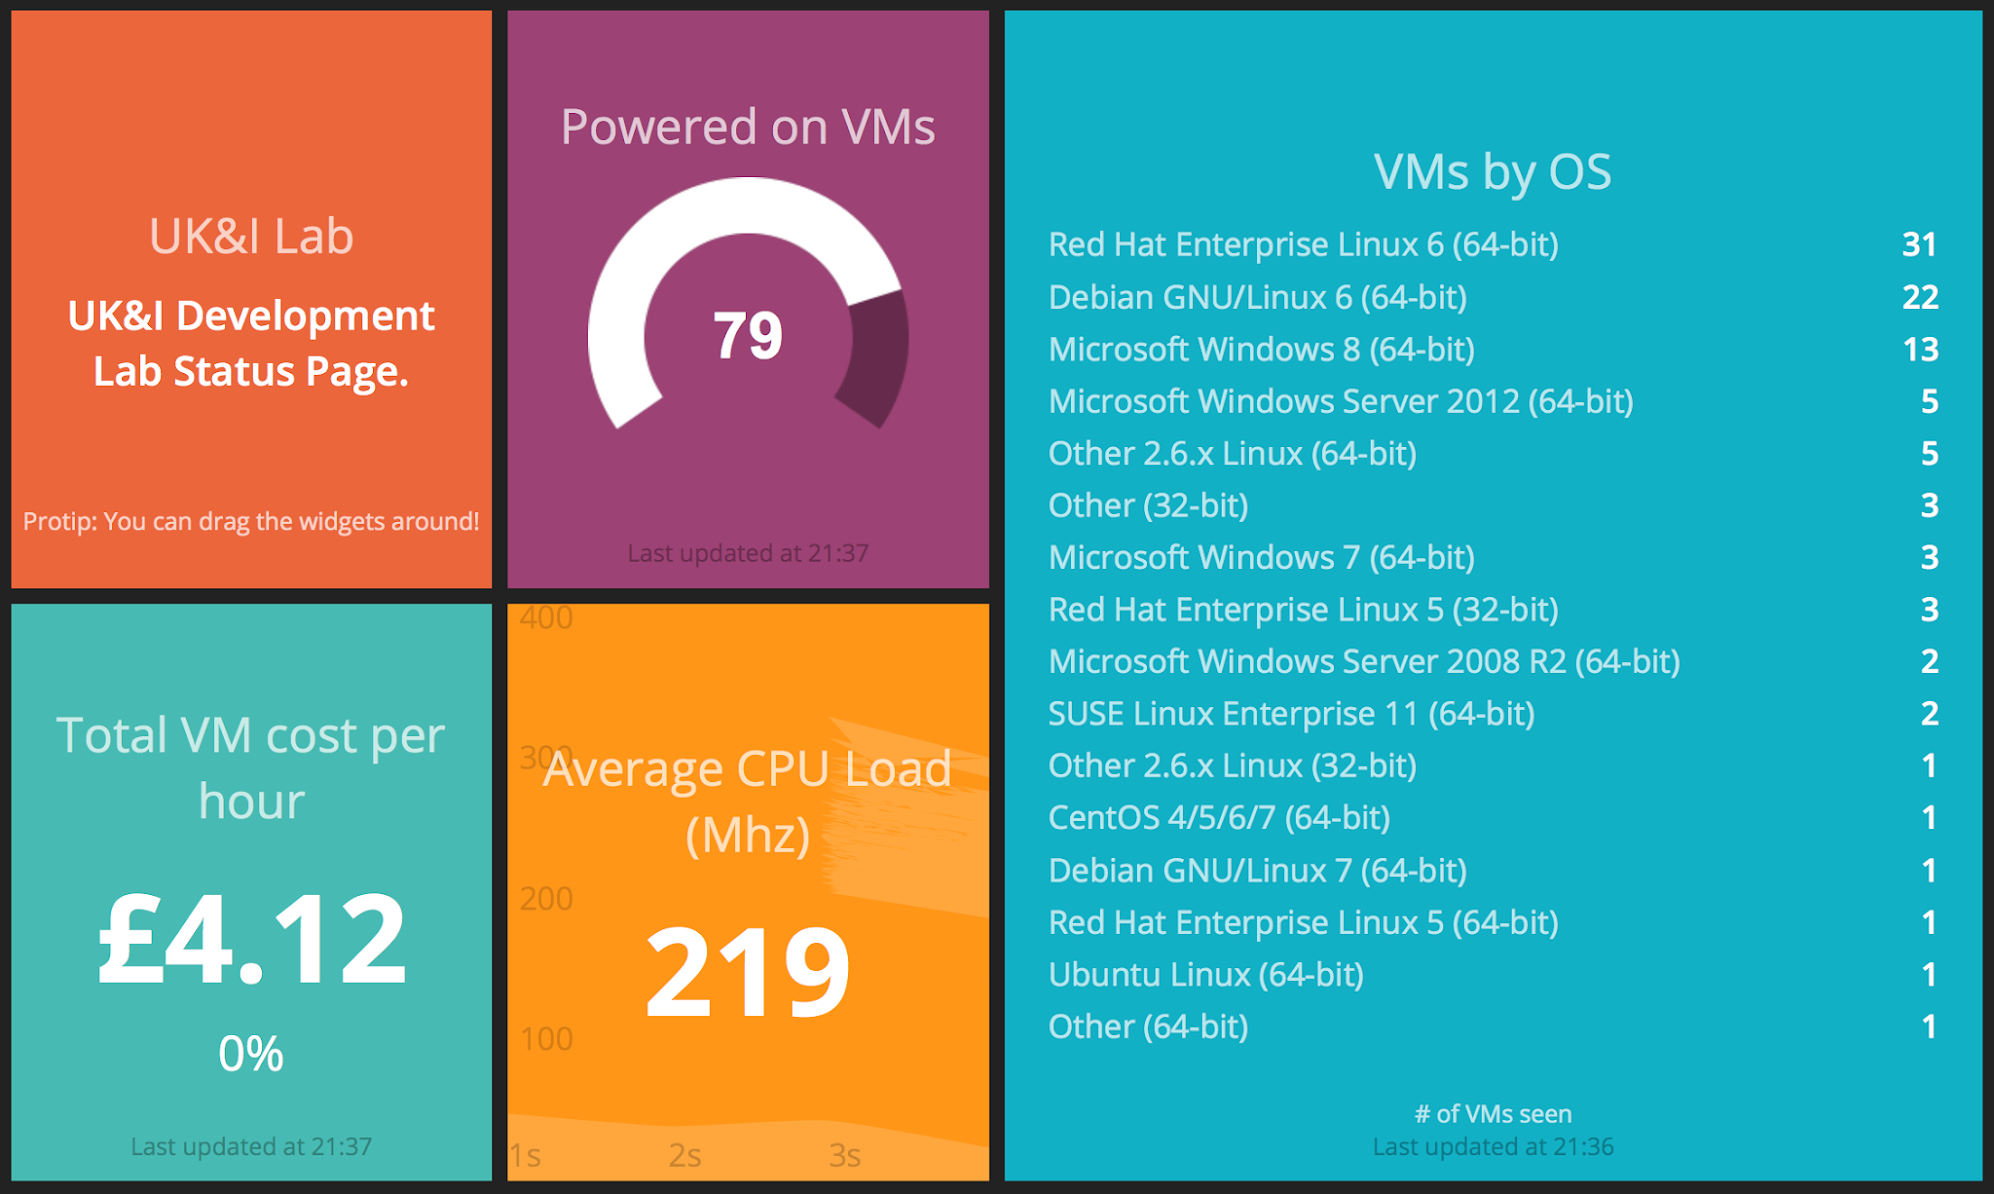
Dashboard
In one of the Leeds DevOps meetups one of the developers pointed me in the direction of a nice graphical dashboard framework, when I 1st saw it I immediately thought it could be used to show the UCSD API’s (and others, like APIC). If you browse to dashing.io you will be able to see what the project is all about.
As part of a recent Cisco TechHuddle roadshow we used this as a demo. The example code can be found in our UK&I GitHub site or also here.
The example is;
Finding the API
So how did I find out what the API was to extract the service requests? You remember at the top I told you to select the ‘Enable Developer Menu’, well that key for the next bits.
API Report Metadata
I know the data that needed to be extracted was contained with in a table in the GUI so I browsed to that location. As the developer menu is enabled an extra button appears called ‘Report Metadata’.
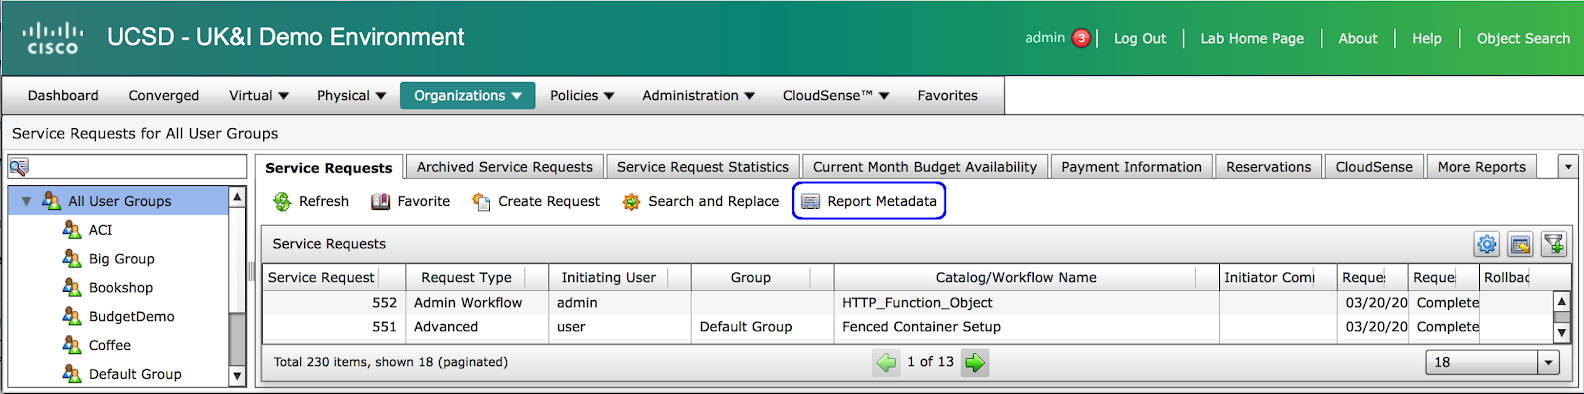
If you select this it will provide API details.
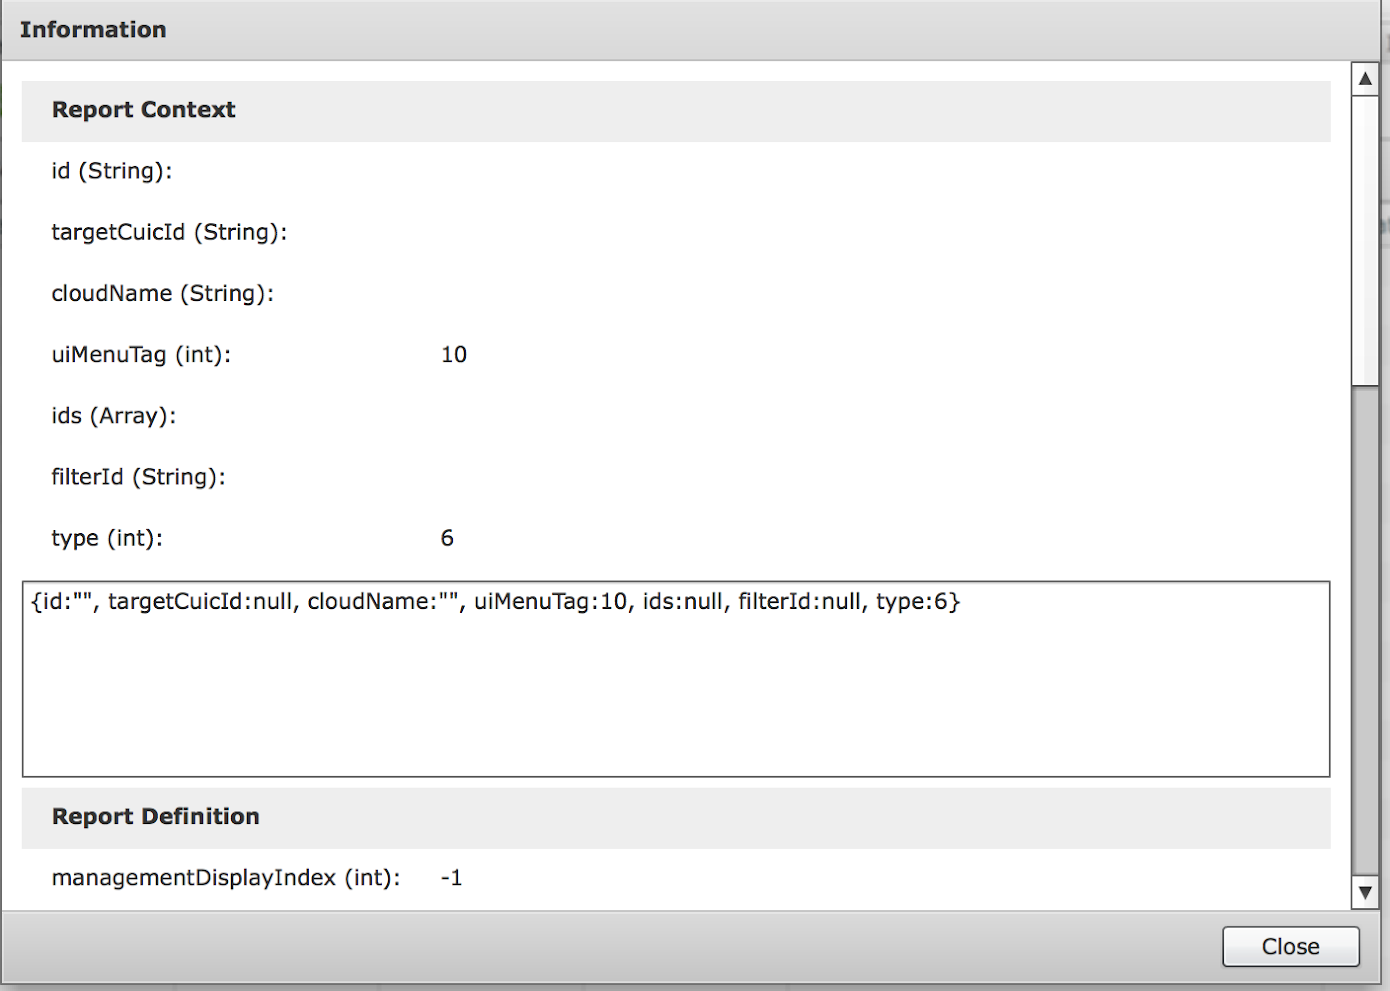
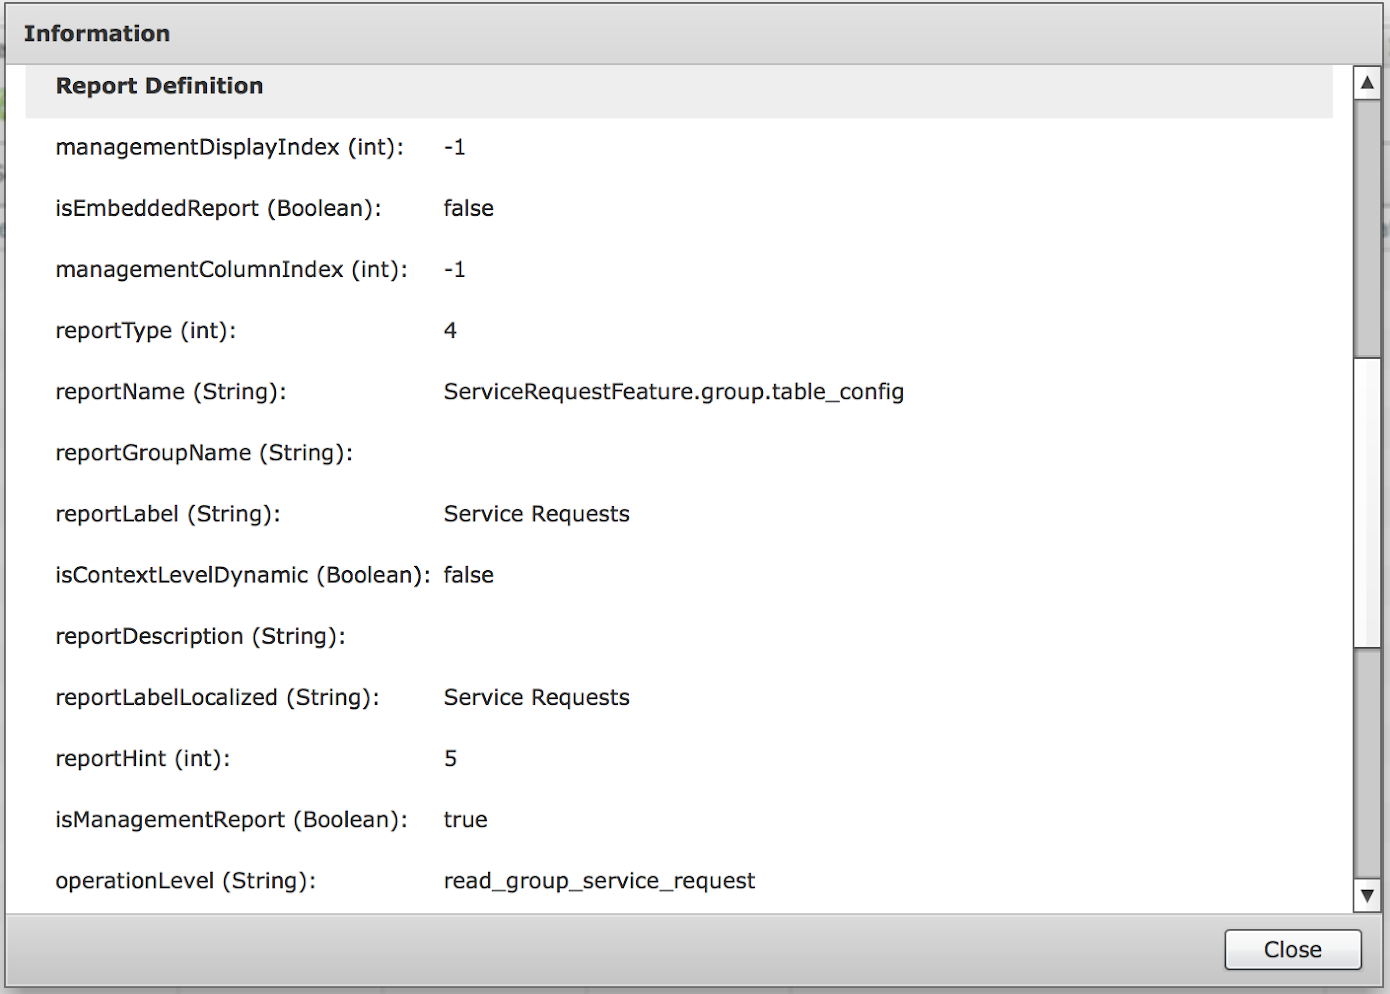
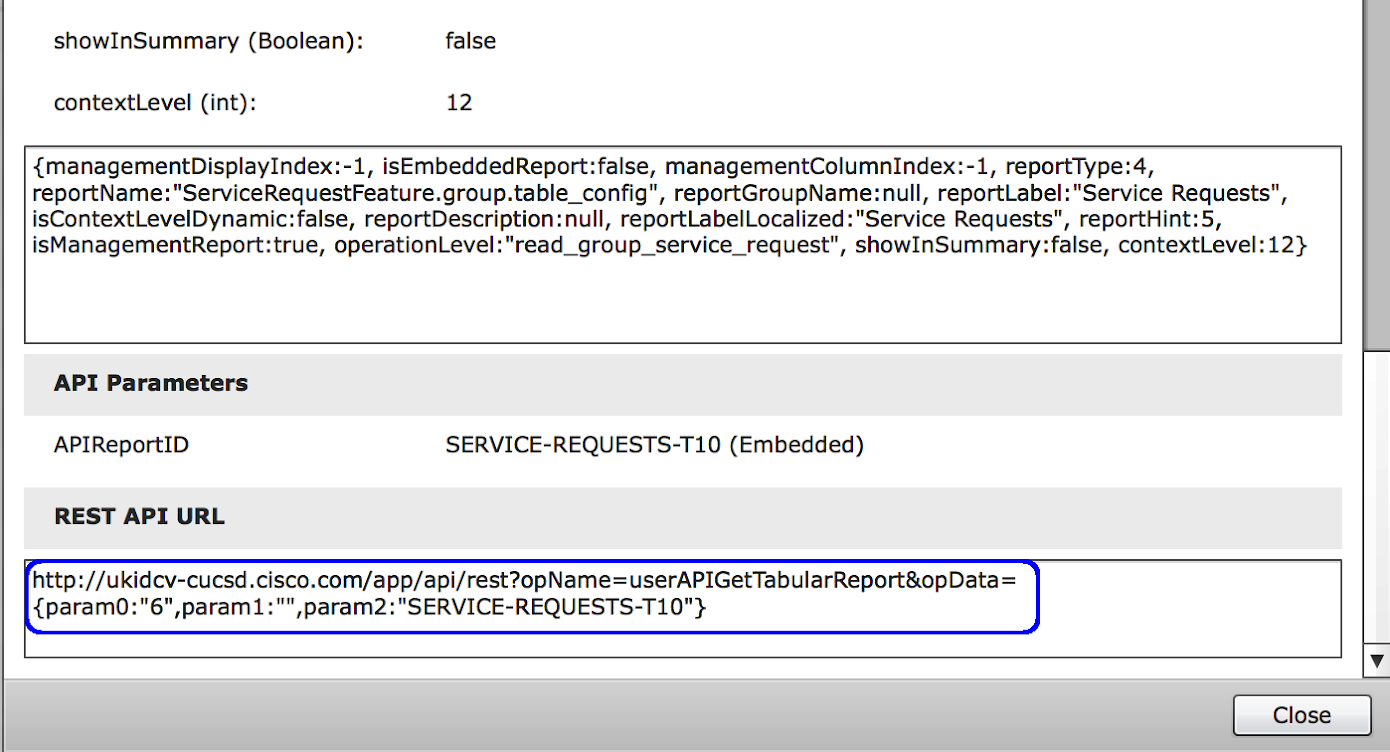
The highlighted string at the bottom of the last screenshot should look familiar now - yes its the API call I used.
API Browser
But what if the data you are trying to retrieve doesn’t have a table in the GUI, or if you are trying to request UCSD to execute something. Well you could read the PDF, OK bad idea. As we have enabled the developer menu we now get access to an API browser.
Select ‘Policies->Orchestration->REST API Browser’ from the menu.
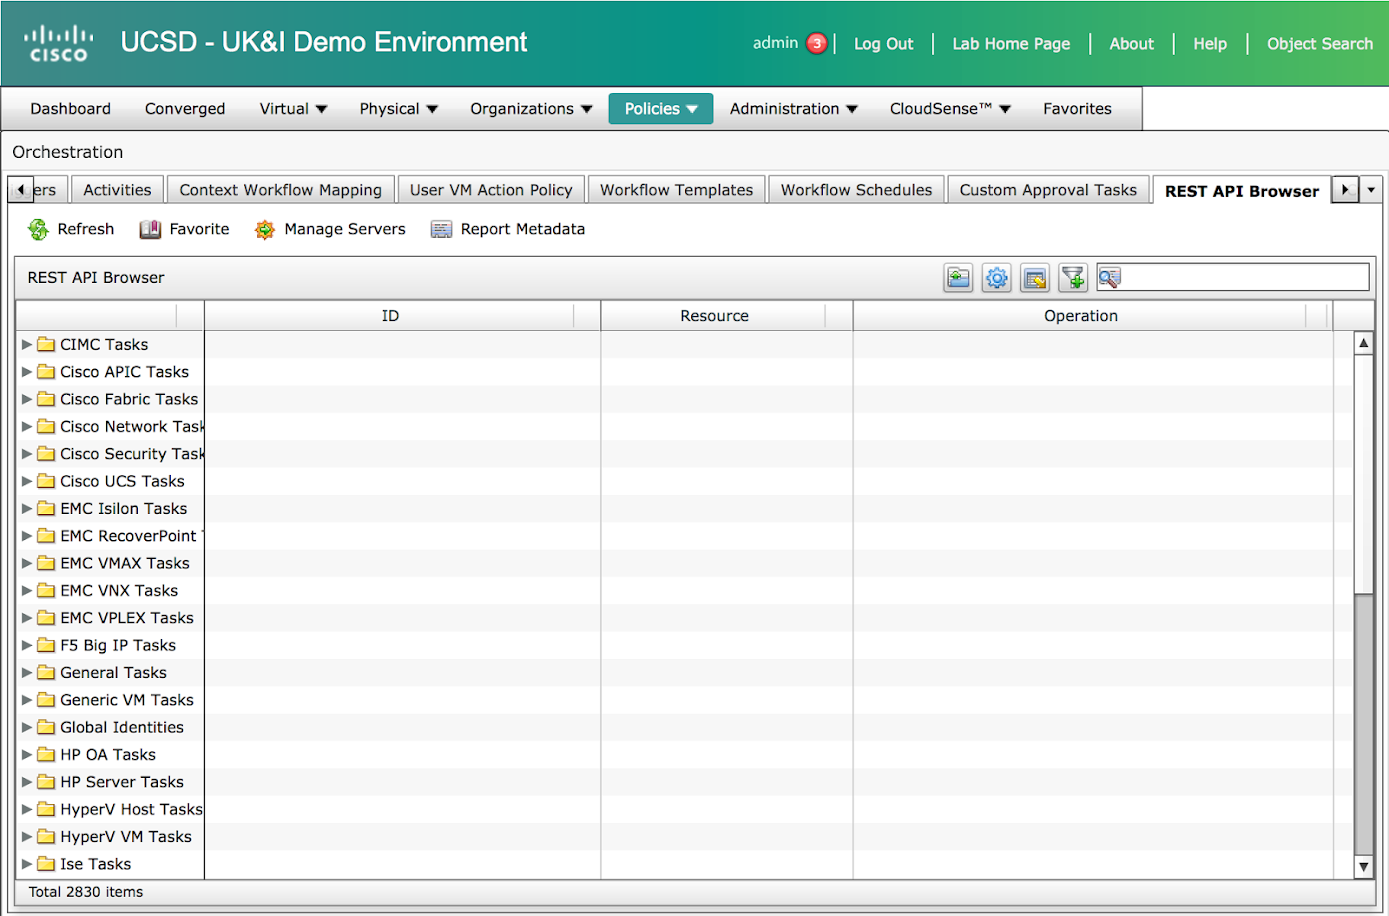
You can now browse the right hand side menu and look for something familiar or you can use the search box. So lets search for the API that we have been using (userAPIGetTabularReport).
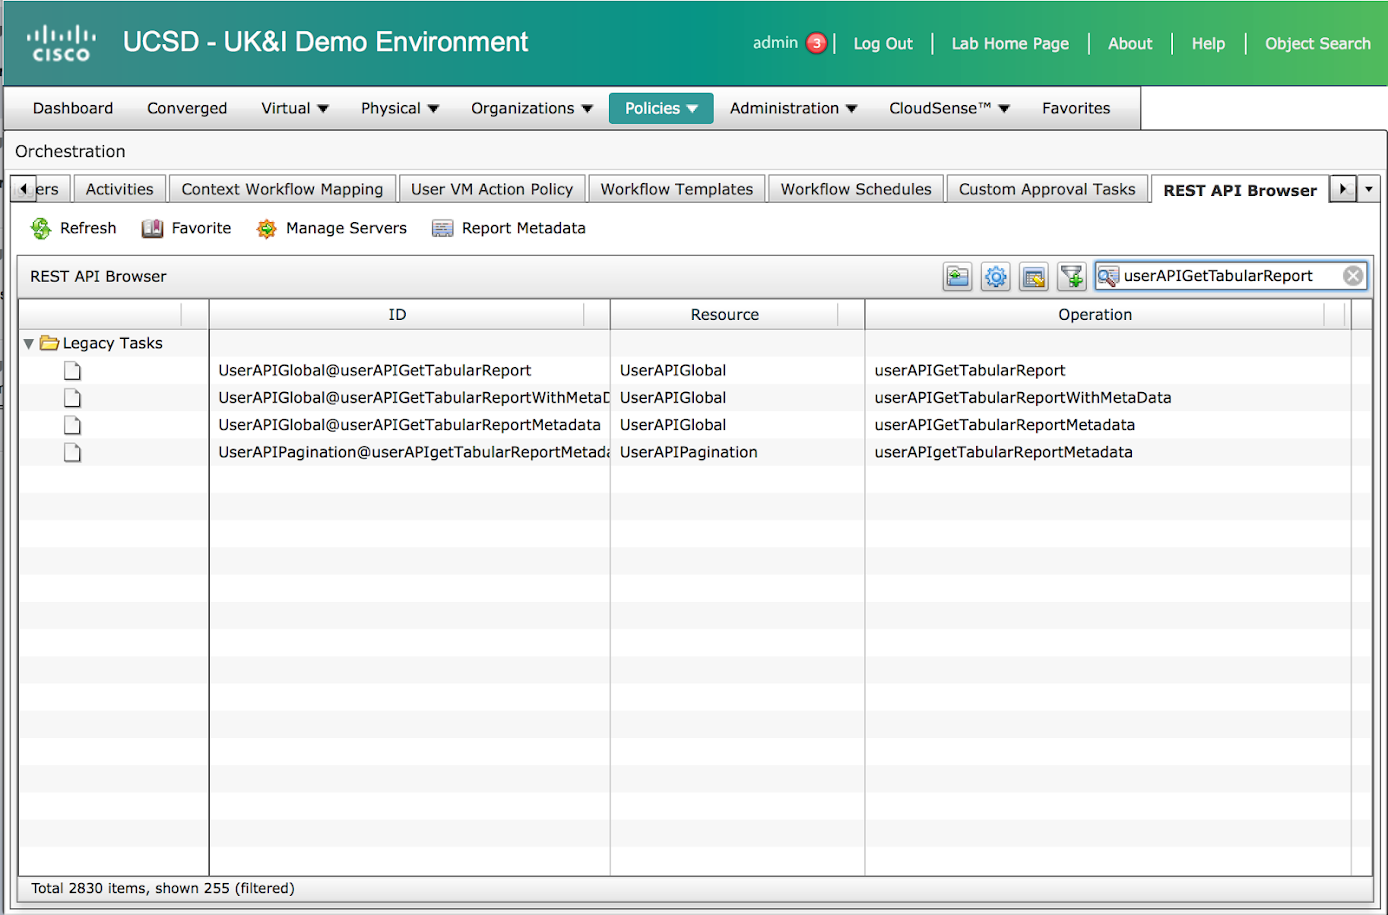
This will let you get more detail on the API and an example of the syntax.
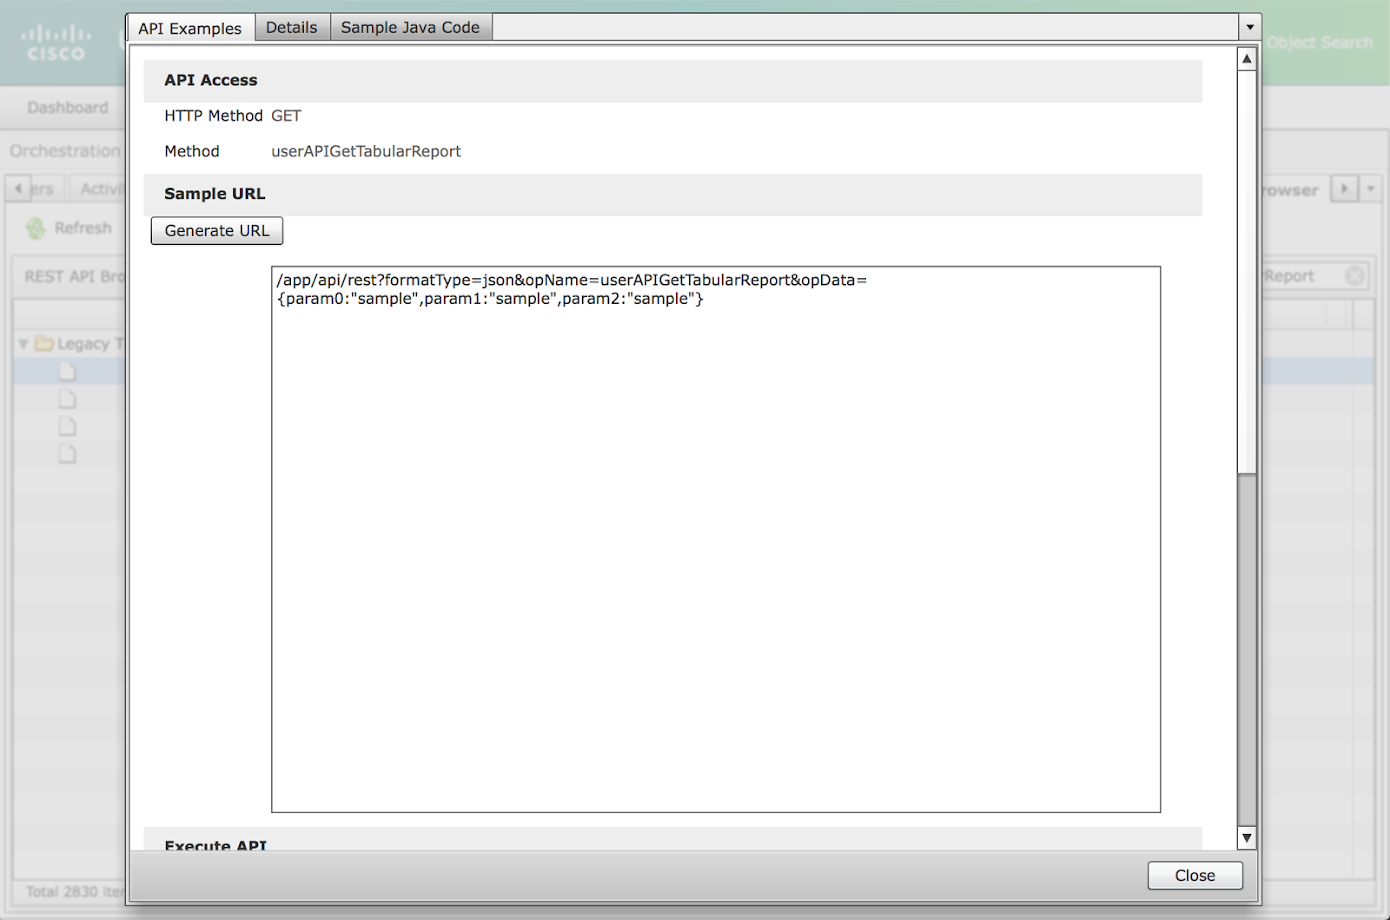
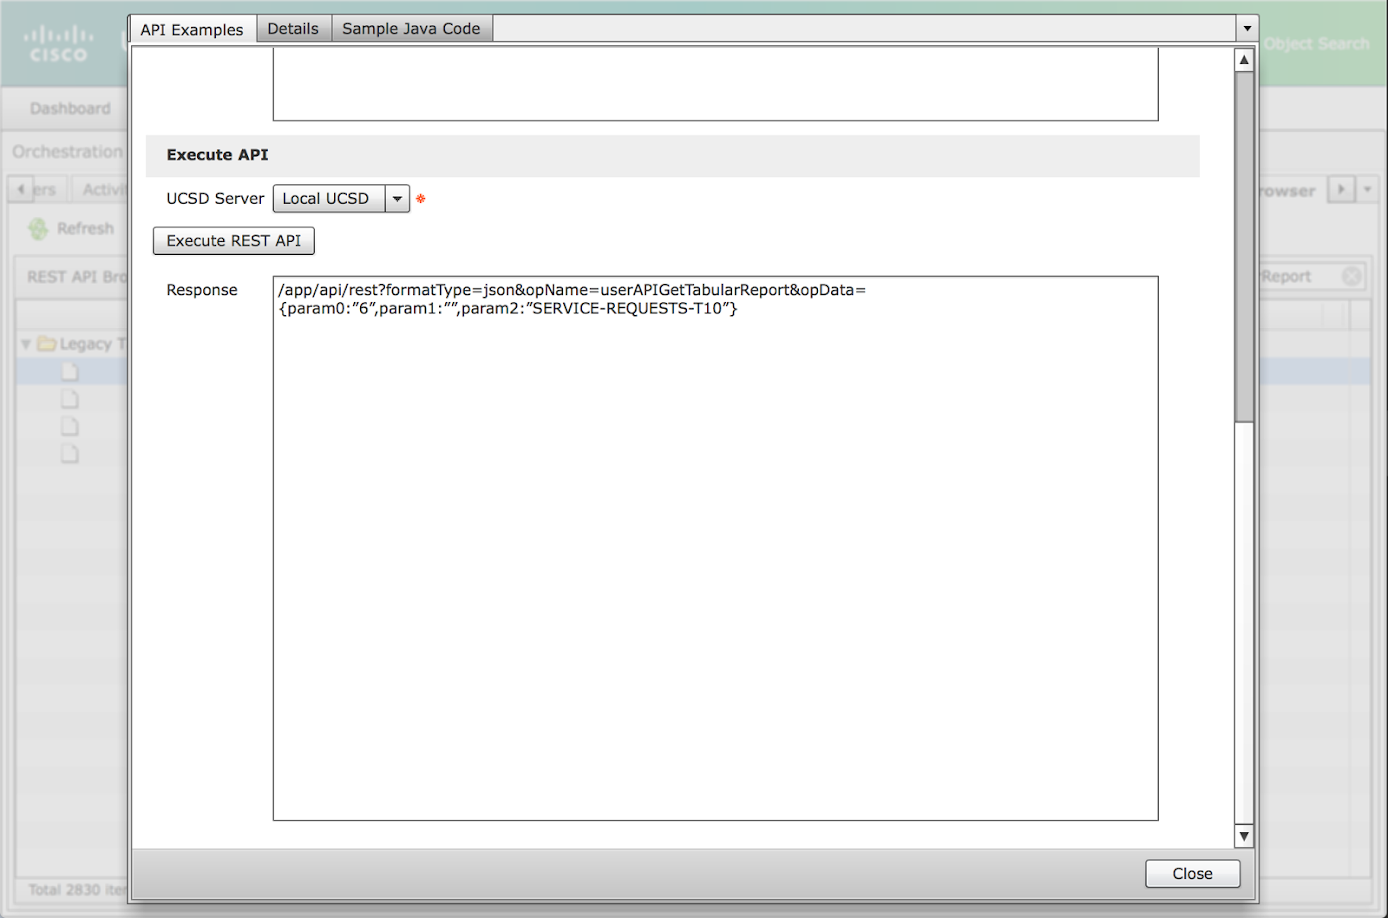
The extremely useful function is that you can test the API call agains the local UCSD install
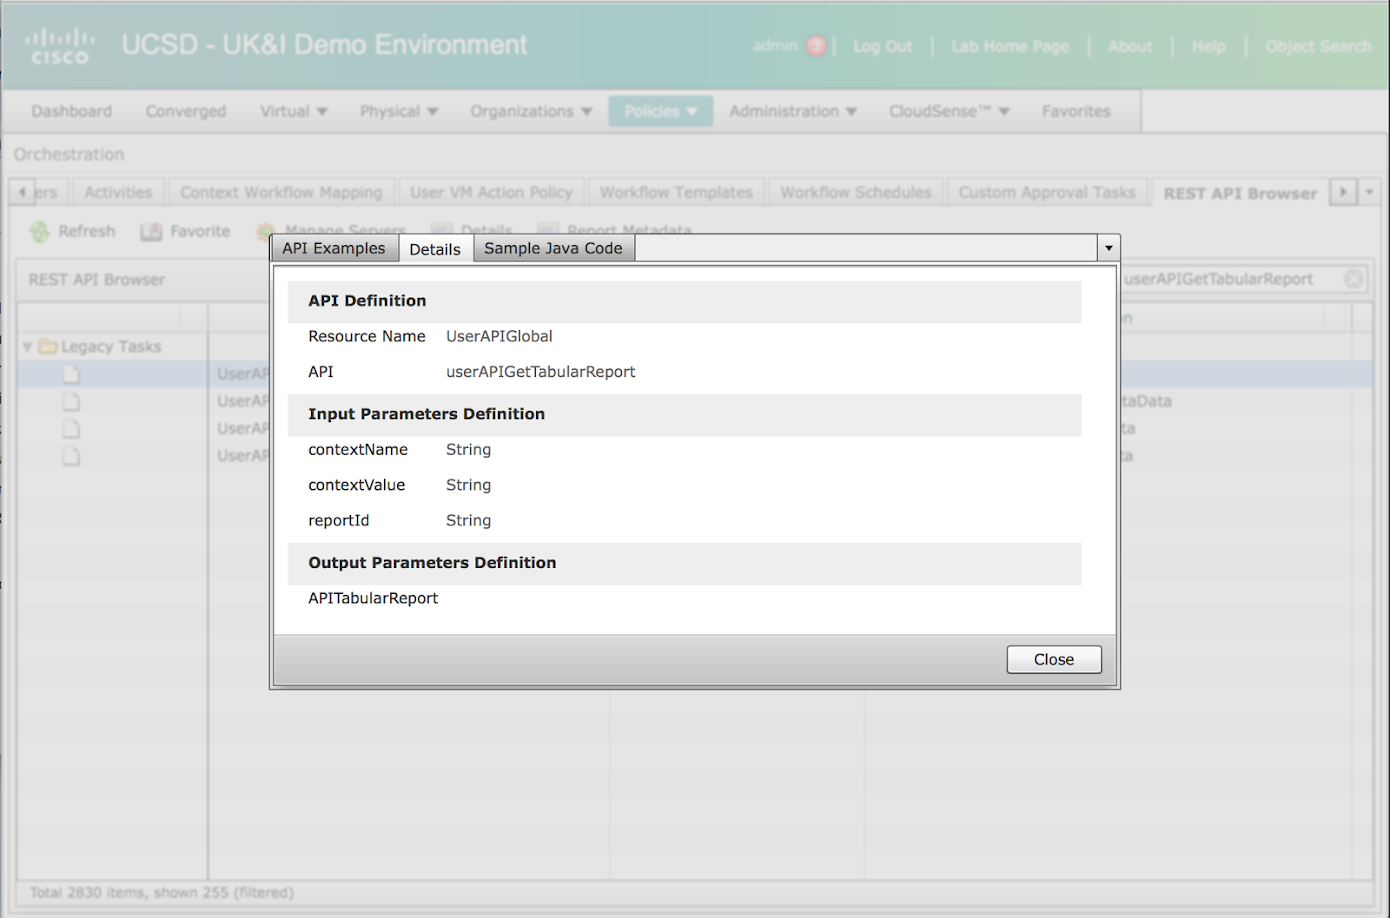
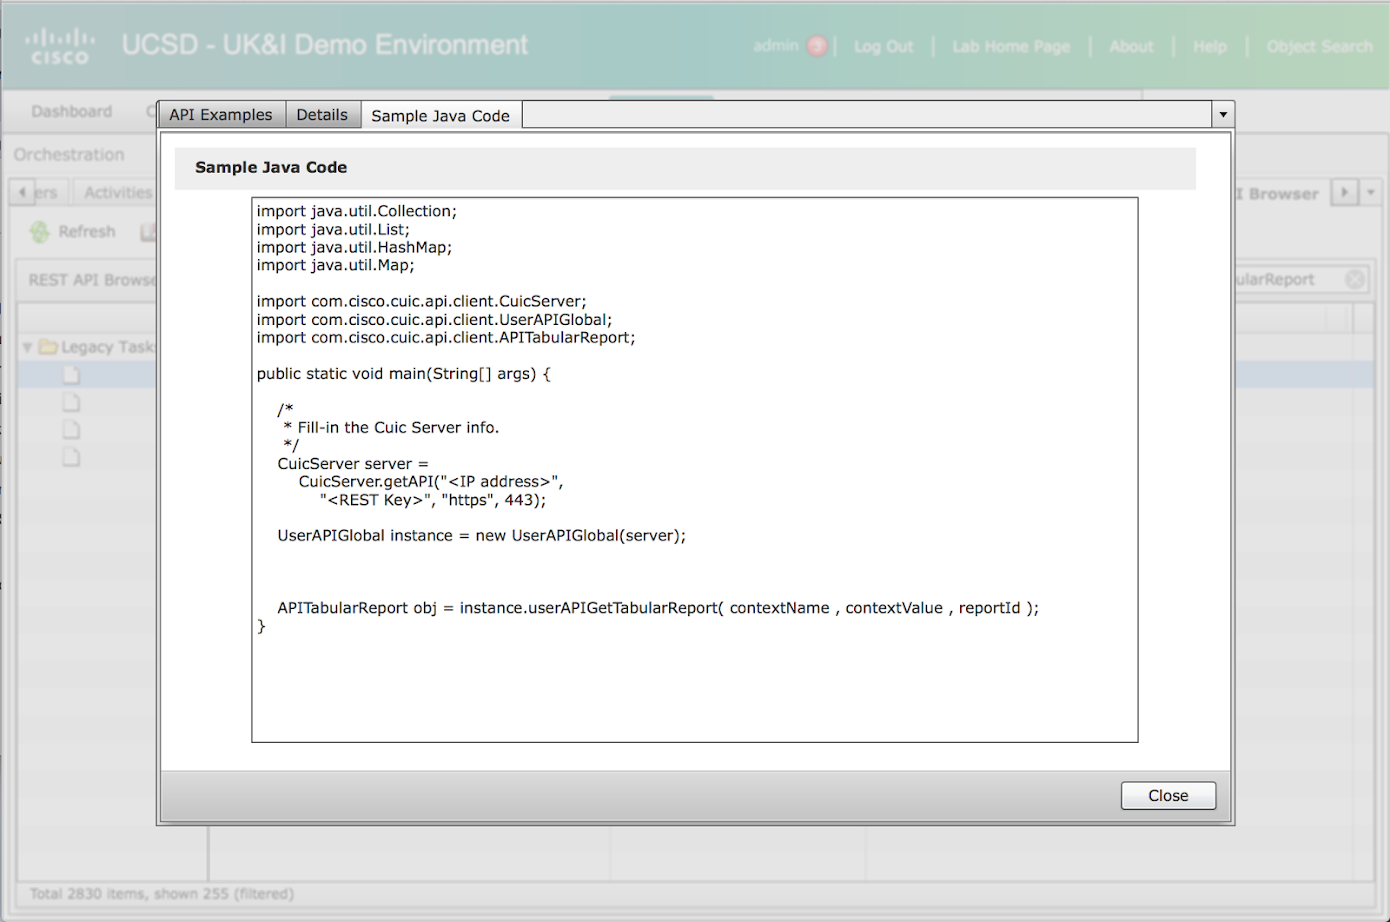
You also get some other detail on the specific API as well as an example java code snippet. This could be useful when you start creating custom automation tasks
Video
I have also put together a supporting video.
Note: To do operations using the work-flow tasks and other actions the version 2 of the APIs need to used. To work with other things such as retrieving reports, Version 1 of the APIs need to be used.